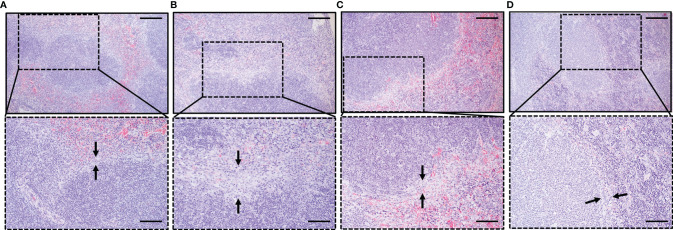
Figure 6.
Histopathological analysis of the spleen depicting the impact of B. microti, B. rodhaini, and co-infection on the spleen compared to uninfected mice. Sections collected on day 6 post-challenge infection were stained with H & E, 100× and 200×. Black arrowheads indicate the variations in the marginal zone relative to (A) Naive mouse group. Erosion of the marginal zone in terms of loss of cellularity was found to be more pronounced in (B) Br mice compared to (C) bm/br4, and (D) bm/br6 mice. Bars in upper and lower images represent 200 and 100 μm, respectively.

