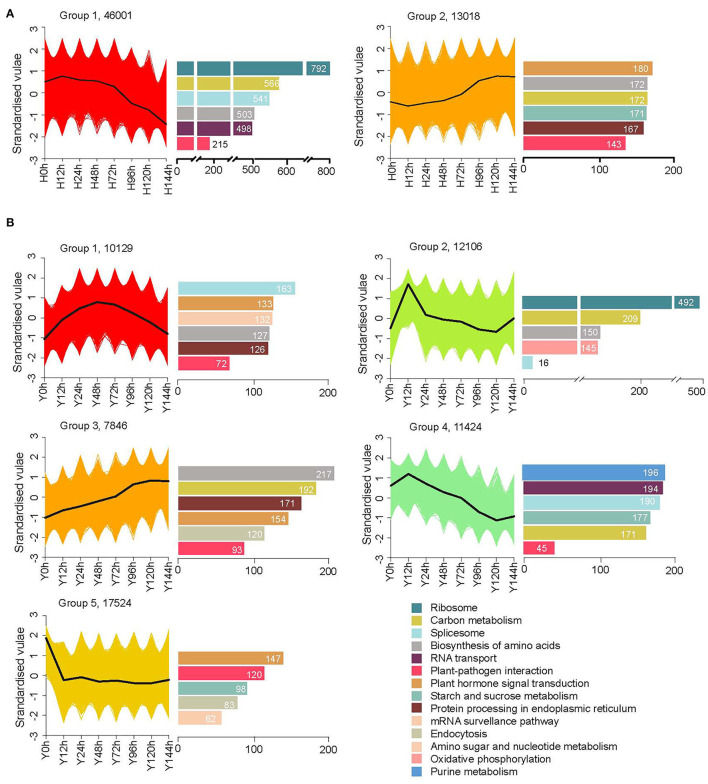
Figure 3.
More sophisticated expression patterns in the resistant cultivar Y (B) than the susceptible cultivar H (A). Cluster assignments of genes with FPKM ≥ 1 are shown in the left graph and, correspondingly, the top five KEGG enriched pathways as well as the “plant–pathogen interaction” pathway are shown in the right bar charts.

