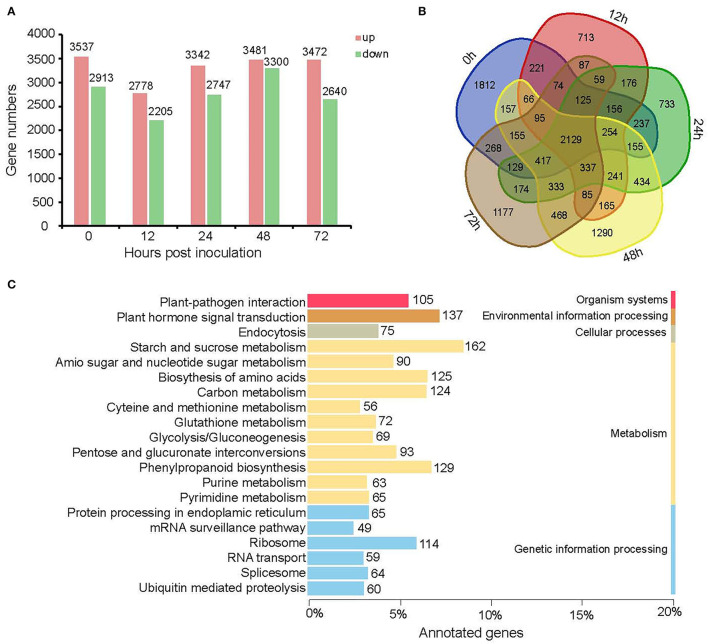
Figure 5.
Differential gene expressions in Y as compared with H at different time points. (A) The column chart shows the number of up-regulated (light coral bars) and down-regulated (spring green bars) genes at each time point. (B) Venn diagrams showing the common and specific DEGs for five time points. (C) The top 20 enriched KEGG pathways of DEGs between Y and H for five time points.

