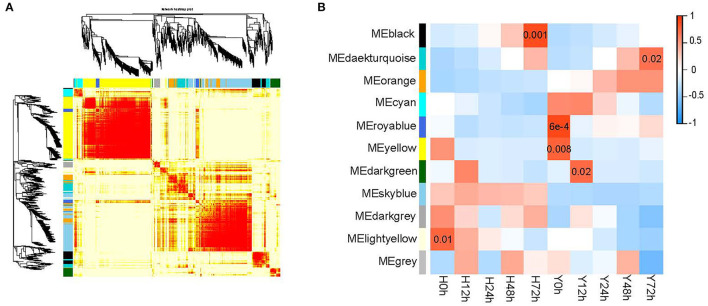
Figure 6.
The construction of gene co-expression modules in both cultivars for five time points. (A) Hierarchical clustering tree (dendrogram) of genes based on co-expression network analysis in Y and H. The branches correspond to modules of highly interconnected genes. Each module was assigned by a unique color; with ungrouped genes colored gray. (B) Correlation between gene co-expression modules (row) and resistance to B. cinerea for two cultivars at five time points (column). The correlation coefficients and the p-value are presented at the top and bottom of the corresponding boxes. The color legend for modules is indicated on the left.

