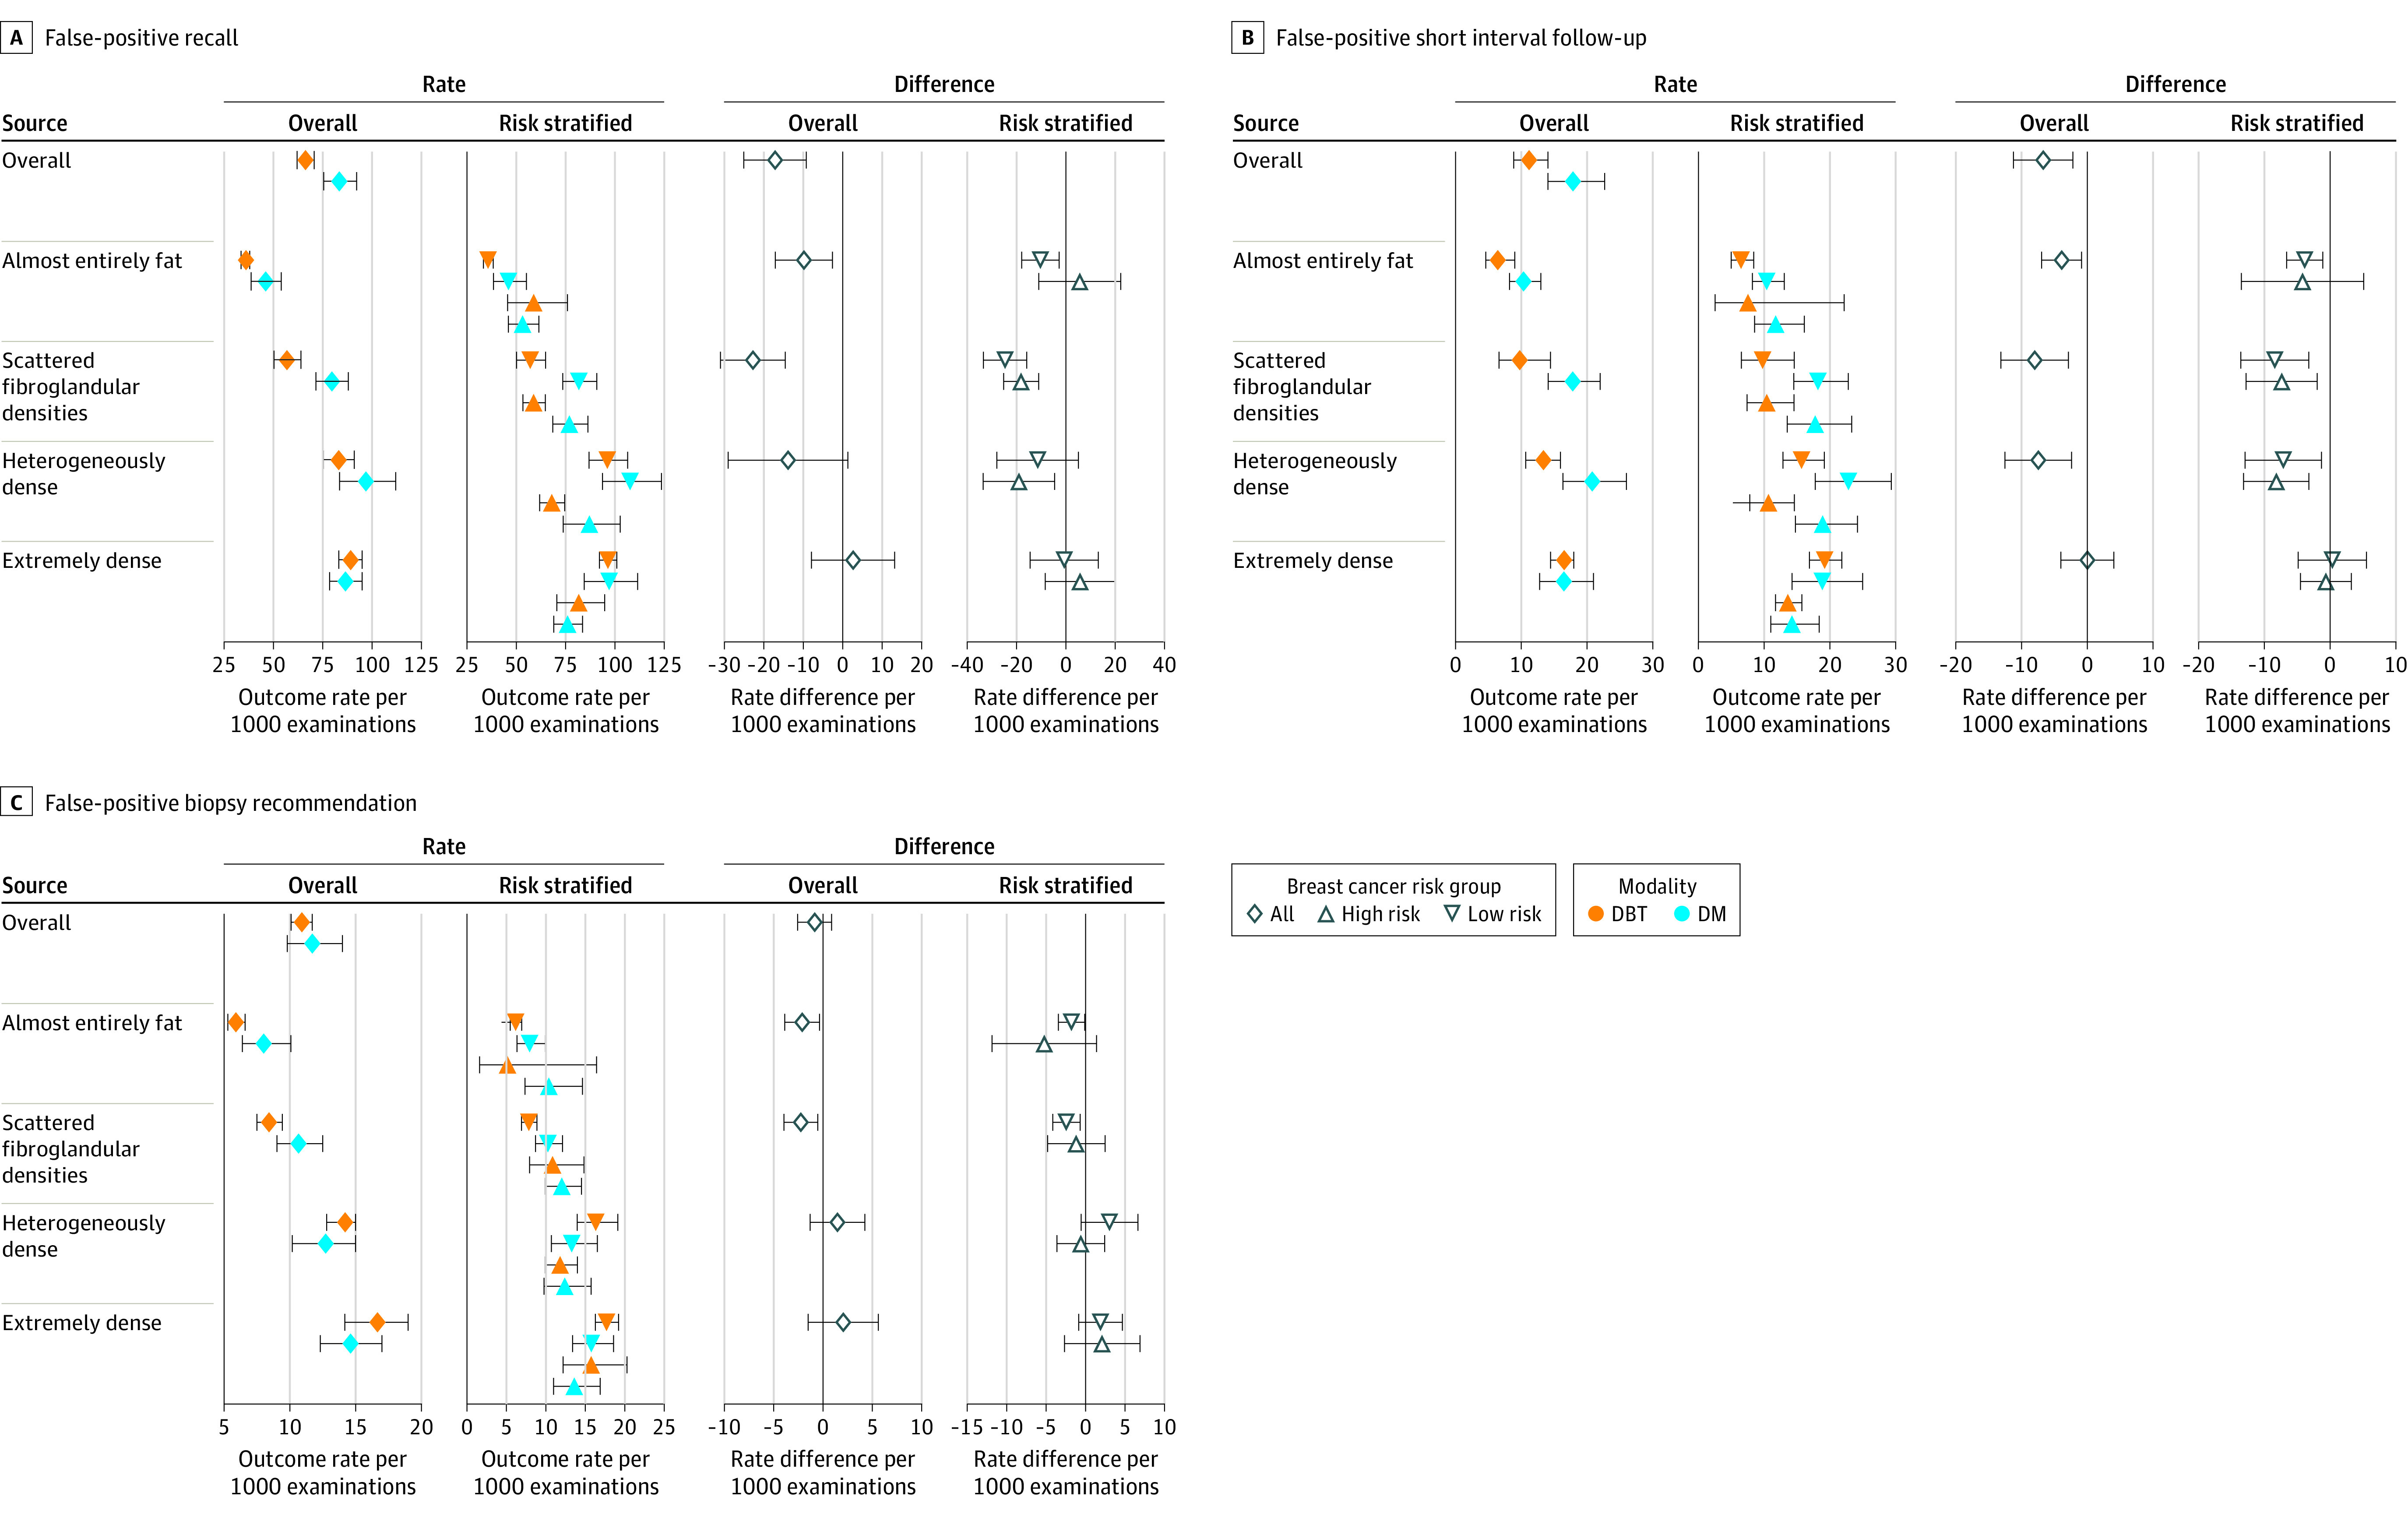
Figure 2. Rates and Absolute Risk Differences per 1000 Breast Cancer Screening Examinations .

Data by breast density categories and 5-year risk categories (low risk <1.67%; high risk ≥1.67%). DM indicates digital mammography; DBT, digital breast tomosynthesis. See eTables 4 and 6 in the Supplement for exact values. 95% CIs represented by whiskers.
