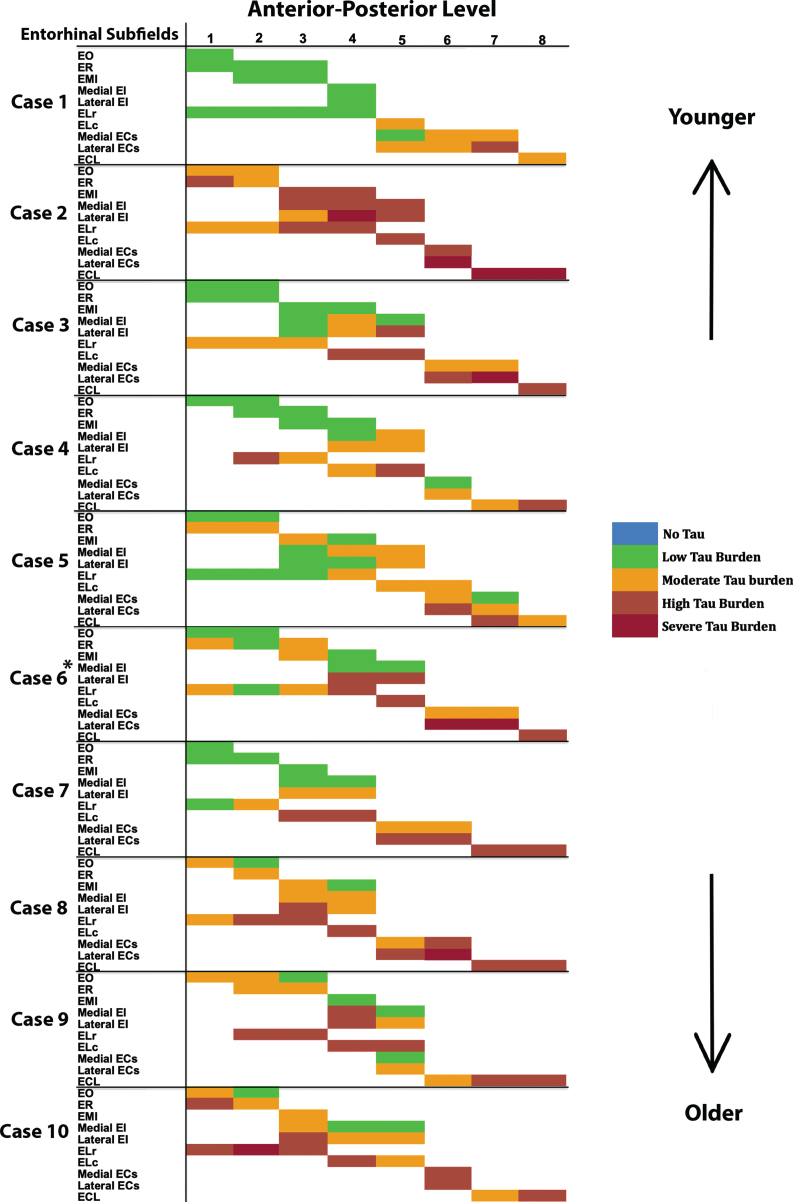
Fig. 4.
Tau Semiquantitative Scores Anterior to Posterior in EC Subfields Displayed as a Matrix (n = 10): Color-coded semi-quantitative tau density scores for all 10 cases showing the subfields within EC (left axis) and the anterior-posterior levels (top axis). Green labeling (score 1) means very low tau/neurofibrillary tangle burden and essentially isolated tangles in this region. Green labels were more prevalent in medial and anterior subregions. Orange (score 2) conveys a moderate tau burden both in number and packing density of NFTs. Rust (score 3) translated to a high tau burden and typically showed more densely packed and strongly stained NFTs and pretangles, with more continuous NTs. Burgundy (score 4) showed the greatest density for phosphorylated tau at CP13, with many closely packed, darkly immunostained NFTs and NTs blanketing most of the area. The position of case 6 (*) was predicted based on tau burden pattern. The cases have been arranged according to age, with the younger cases on the top and the older cases on the bottom (see Table 1 for specific ages for each case).

