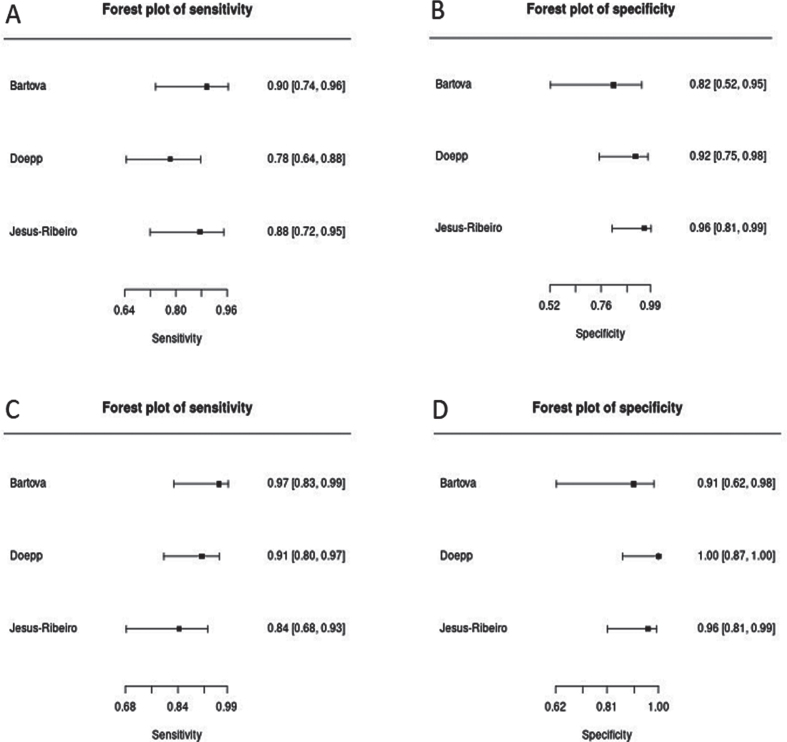
Fig. 4.
Forest plots of sensitivity and specificity of TCS (A, pooled sensitivity: 84.1%, 95% CI: 75.9–89.9%; B, pooled specificity: 91.9%, 95% CI: 82.0–96.6%) versus DaTSCAN (C, pooled sensitivity: 90.7%, 95% CI: 83.5–94.9%; D, pooled specificity: 96.8%, 95% CI: 88.0–99.2%) for the diagnosis of PD versus ET.

