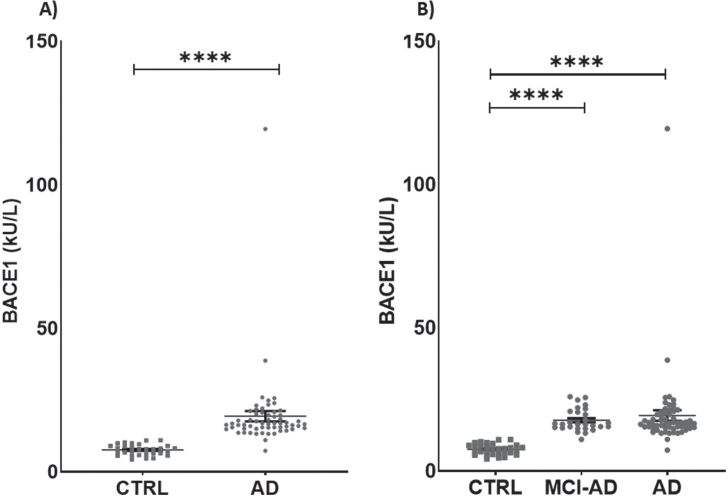
Fig. 1.
Levels of BACE1 in patients and in controls. A) BACE1 in AD + MCI-AD group (mean±SEM:19.390±1.825) is higher than in CTRL group (mean±SEM: 7.626±0.343, p < 0.0001; Mann-Whitney test). B) BACE1 is significantly higher in AD (mean±SEM: 20.88±3.929) and MCI-AD (mean±SEM: 17.73±0.7426) groups as compared to CTRL group (mean±SEM: 7.626±0.343, p < 0.0001; Kruskal-Wallis test with Dunn’s multiple comparisons post-hoc test). Outliers’ removal (in AD + MCI-AD group in A, and in AD group in B) did not affect the statistical evidence of group differences.

