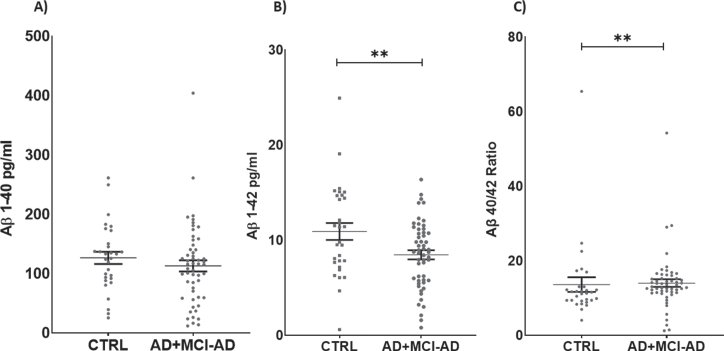
Fig. 2.
Serum levels of Aβ1 - 40 (A), Aβ1 - 42 (B), and ratio Aβ1 - 40/42 (C). Aβ1 - 42 is significantly lower in AD + MCI-AD group (mean±SEM: 8.760±0.476) as compared to CTRL group (mean±SEM: 10.590±0.887, p = 0.0090; t-test); on the contrary the Aβ40/42 ratio is higher in AD + MCI-AD (mean±SEM: 14.01±1.028) as compared to CTRL (mean±SEM: 13.62±1.953, p = 0.0042; Mann-Whitney test).

