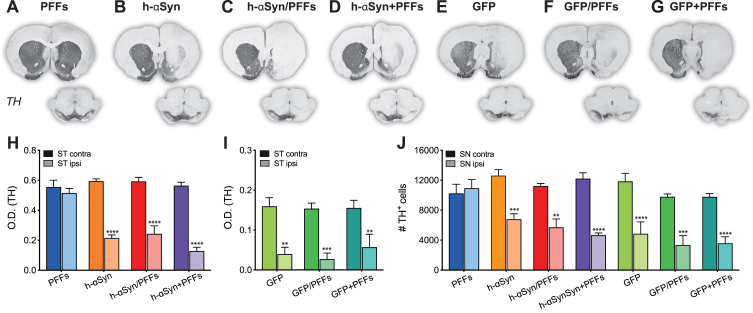
Fig. 3.
TH downregulation in striatum and substantia nigra. A-G) TH immunoreactivity from representative midbrain and striatal sections. H-I) Densitometric analysis comparing TH staining intensity between left and right striatum. J) Cell count of TH+ cells in the SNpc represented as number of TH+ cells between contralateral and ipsilateral SNpc. PFFs, preformed fibrils; h-αSyn, human alpha-synuclein; GFP, green fluorescent protein; ST, striatum; SN, substantia nigra pars compacta; O.D., optical density. Data are expressed as mean ± SEM. (**p < 0.01, ***p < 0.001, ****p < 0.0001).

