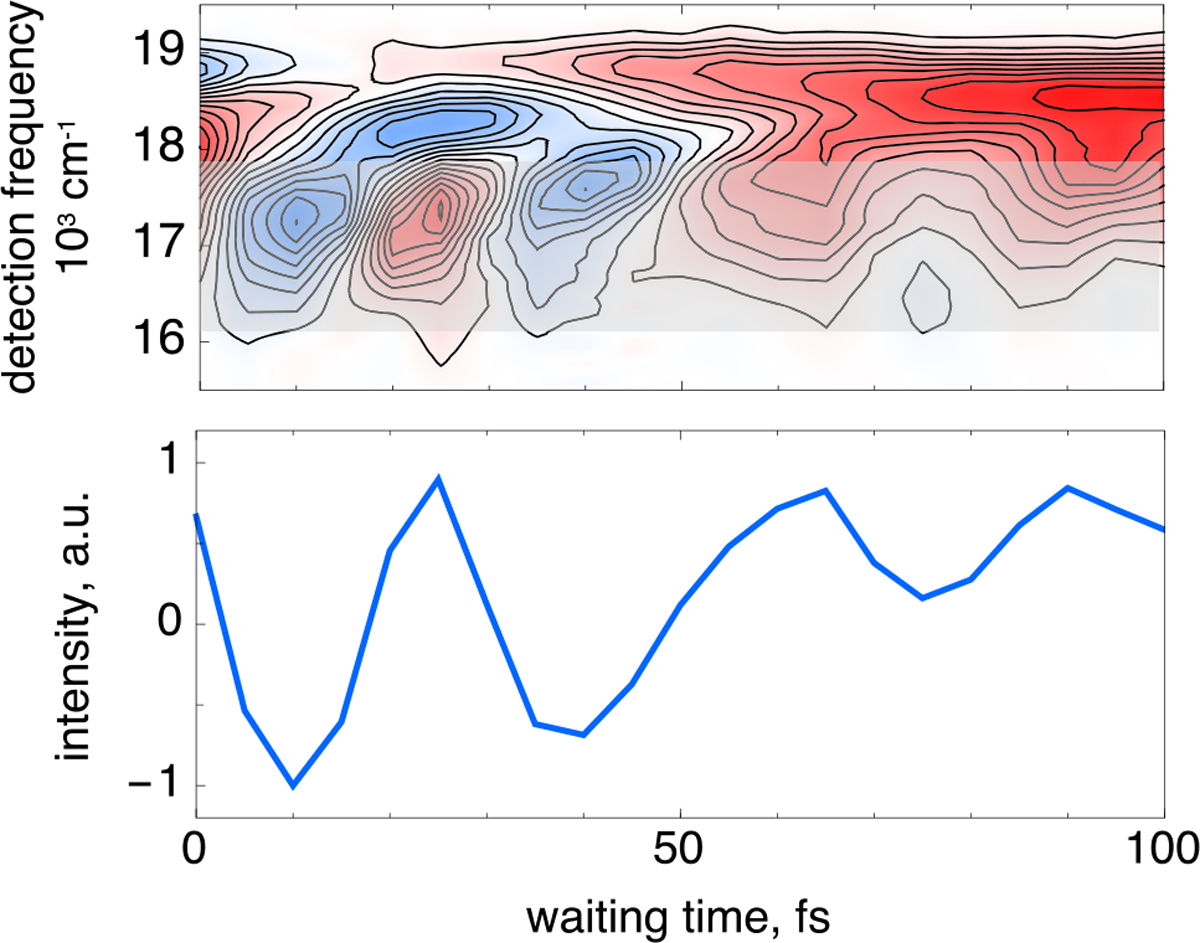
Figure 3.

Waiting time dynamics associated with excitation of the high-frequency vibronic shoulder over the range shown in Figure 2. Broad, large-amplitude oscillatory dynamics are observed over the first 100 fs following photoexcitation (top). These plots are produced by integration of the 2D spectra over the excitation frequencies from 18000 to 19000 cm−1 (see the gray highlighted region in the first panel of Figure 2). Spectral integration of the gray translucent region in the top panel shows significant absorptive features centered at waiting times of approximately 10, 40, and 75 fs (bottom).
