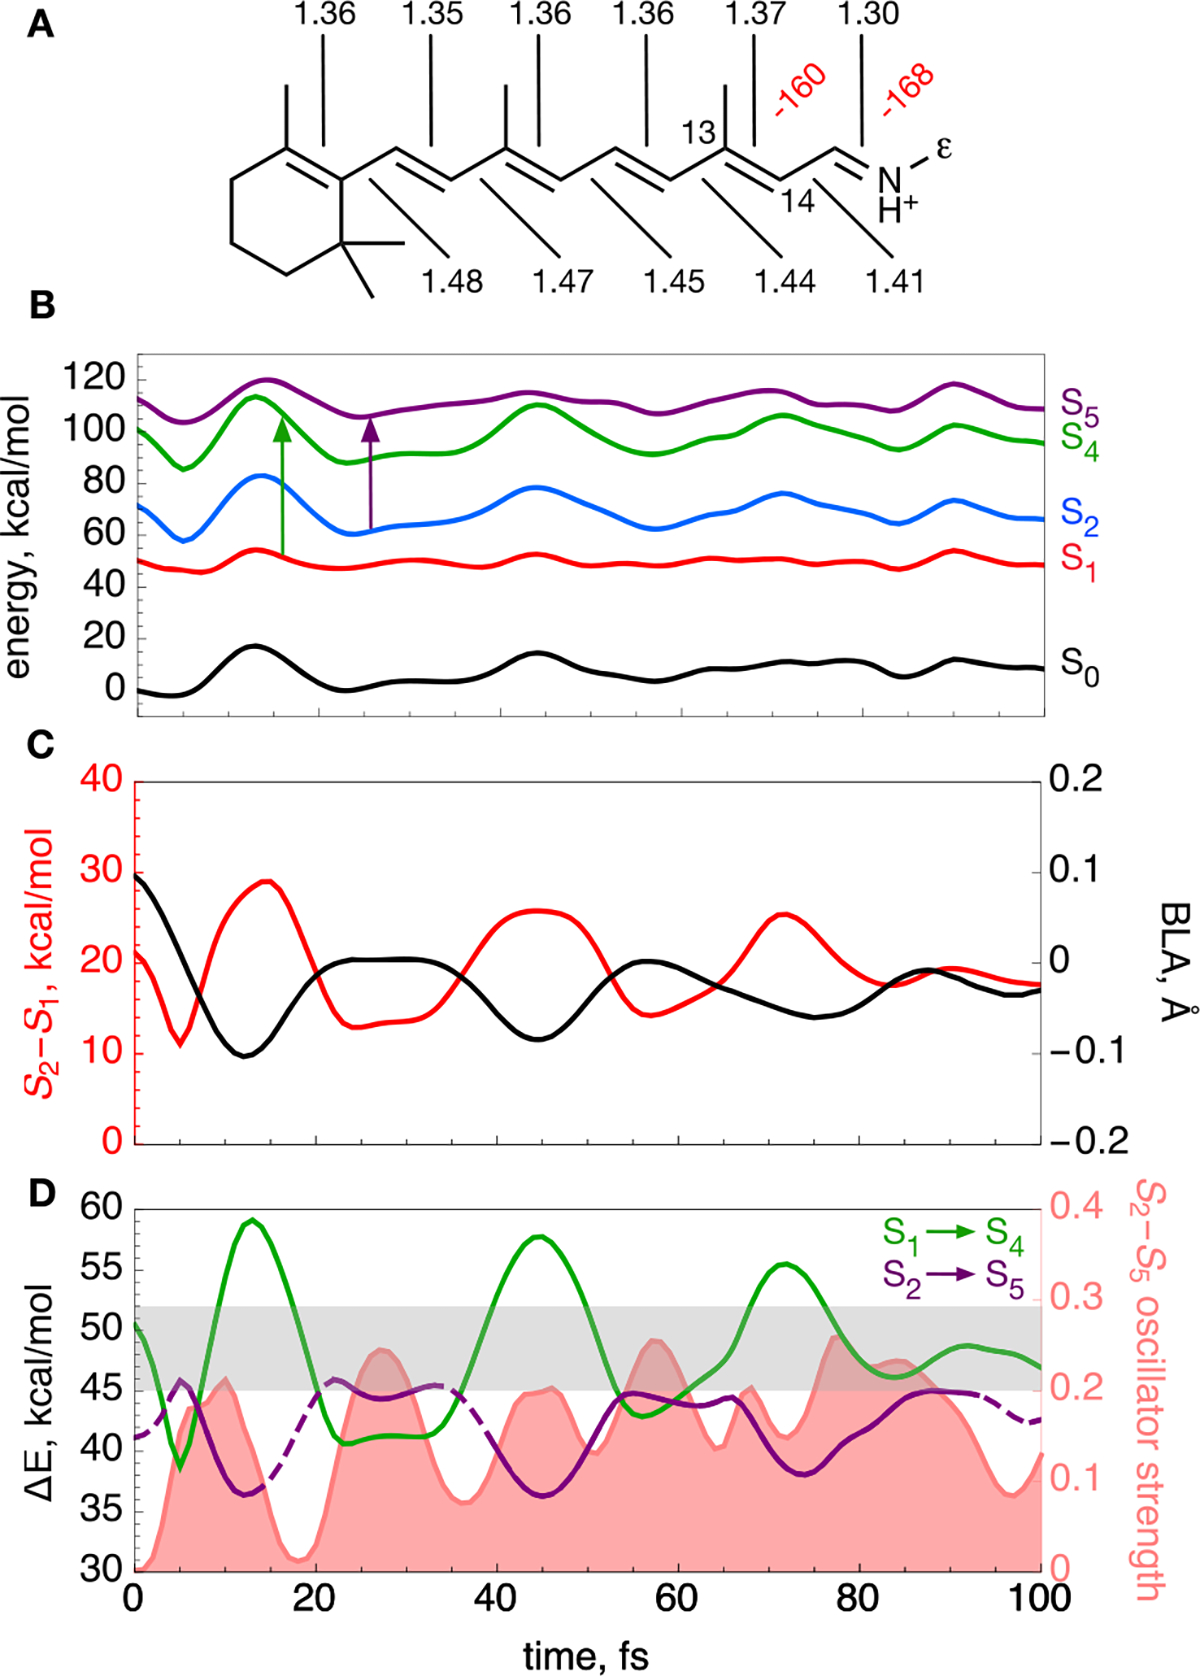
Figure 4.

Computational modeling of bR. (A) Computed equilibrium structure of bR rPSBAT. Backbone dihedral angles twisted more than 10° are labeled in red. Bond lengths along the conjugated backbone are labeled in black (in angstroms). The ε indicates the Cε atom. (B) S0–S2, S4, and S5 CASPT2/AMBER energy profiles (black, red, blue, green, and purple lines, respectively) along the S1 trajectory released from the S0 equilibrium structure. The vertical arrows indicate the investigated electronic transitions. (C) Evolution of the BLA coordinate (black line) describing the elongation of double bonds coupled with shortening of single bonds along the trajectory. Also shown is the S2–S1 energy gap (red). (D) Evolution of the S1 → S4 and S2 → S5 energy gaps along the trajectory (green and purple lines, respectively). The lines are dashed when the oscillator strength of the corresponding transition has an oscillator strength of <0.1. The S2 → S5 oscillator strength is shown as the light red area. The experimental detection window is shaded in gray in the graph. Note that the S1 → S5 and S2 → S4 transitions have a low oscillator strength along the entire trajectory.
