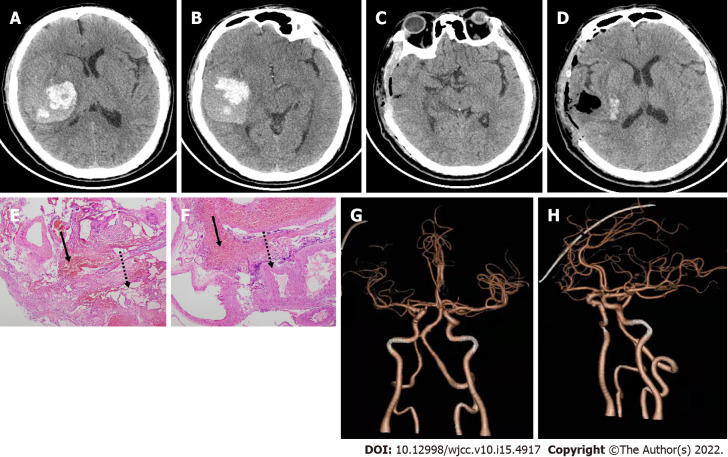
Figure 1.
Axial computed tomography scans, postoperative computed tomography angiography and histopathology. A and B: Tight temporal hemorrhage on the day of admission; C and D: Hematoma is completely cleared on the 1st d after the operation; E and F: Histopathology (E and F, hematoxylin and eosin stain), original × 40 magnification. Dashed arrows indicate vascular malformations with an uneven thickness of the blood vessel wall and varying size of the blood vessel cavity. Solid arrows indicate many red cells in the blood; G and H: Computed tomography angiography showing normal cerebrovascular after the operation.

