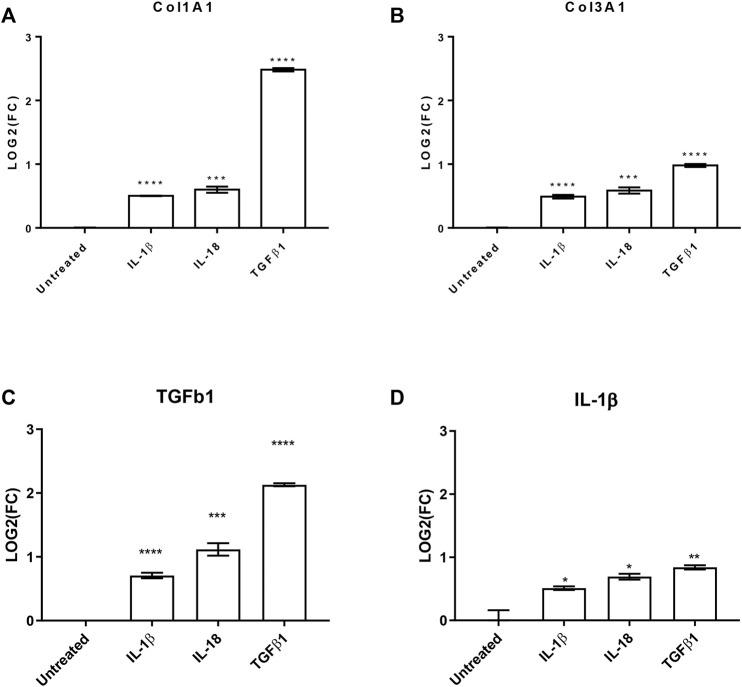
FIGURE 3.
IL-1β and IL-18 effects on pro-fibrotic and pro-inflammatory genes. Bar graphs reporting the relative gene expression of (A) collagen 1A1 (Col1A1), (B) collagen 3A1 (Col3A1), (C) transforming growth factor β1 (TGFβ1), and (D) interleukin 1β (IL-1β) of human cardiac fibroblasts under IL-1β, IL-18, and TGFβ1 (as positive control) treatments (n = 3). Data are expressed by mean ± SEM. *p < 0.05; **p < 0.01; ***p < 0.001; ****p < 0.0001 vs. untreated.

