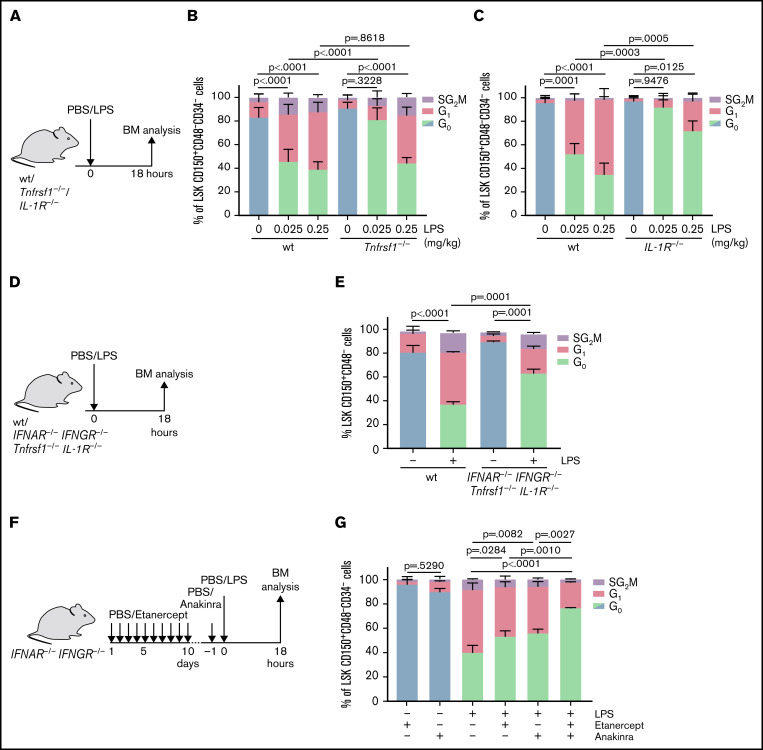
Figure 6.
An LPS-induced cytokine cascade promotes HSC proliferation in vivo. (A) Scheme indicating in vivo treatment of wt and Tnfrsf1−/− or IL-1R−/− mice with PBS (control) or increasing concentrations of LPS for 18 hours. (B) Cell cycle analysis (icKi67-Hoechst 33342) of HSCs (LSK CD150+CD48-CD34-) from wt and Tnfrsf1−/− mice treated with PBS (control) or LPS (indicated concentrations, 18 hours) (n = 6). P values refer to G0 phase and were determined by ANOVA Tukey’s post hoc test. (C) Cell cycle analysis (icKi67-Hoechst 33342) of HSCs (LSK CD150+CD48-CD34-) from wt and IL-1R−/− mice treated with PBS or LPS (indicated concentrations, 18 hours) (n = 3). P values refer to G0 phase and were determined by ANOVA Tukey’s post hoc test. (D) Scheme indicating in vivo treatment of IFNAR−/− IFNGR−/− Tnfrsf1−/− IL-1R−/− mice with PBS (control) or LPS (0.25 mg/kg) for 18 hours. (E) Cell cycle analysis (icKi67-Hoechst 33342) of HSCs (LSK CD150+CD48-) from IFNAR−/− IFNGR−/− Tnfrsf1−/− IL-1R−/− mice treated with PBS (control) or LPS (0.25 mg/kg, 18 hours) as indicated in Figure 6D (n = 3). P values refer to G0 phase and were determined by ANOVA Tukey’s post hoc test. (F) Scheme indicating in vivo treatment of IFNAR−/− IFNGR−/− mice with TNFα inhibitor etanercept (5 mg/kg in 100 μL of PBS on days 1-5; 7.5 mg/kg in 150 μL of PBS on days 6-10) and subsequent PBS (control) or LPS (0.25 mg/kg) treatment for 18 hours. IL-1 inhibitor anakinra (2.5 mg/kg) was injected 1 hour before PBS/LPS treatment. (G) Cell cycle analysis (icKi67-Hoechst 33342) of HSCs (LSK CD150+CD48-CD34-) from IFNAR−/− IFNGR−/− mice treated with etanercept/anakinra as indicated in Figure 6F and treated with PBS (control) or LPS (0.25 mg/kg, 18 hours) (n = 3). P values refer to G0 phase and were determined by ANOVA Tukey’s post hoc test.

