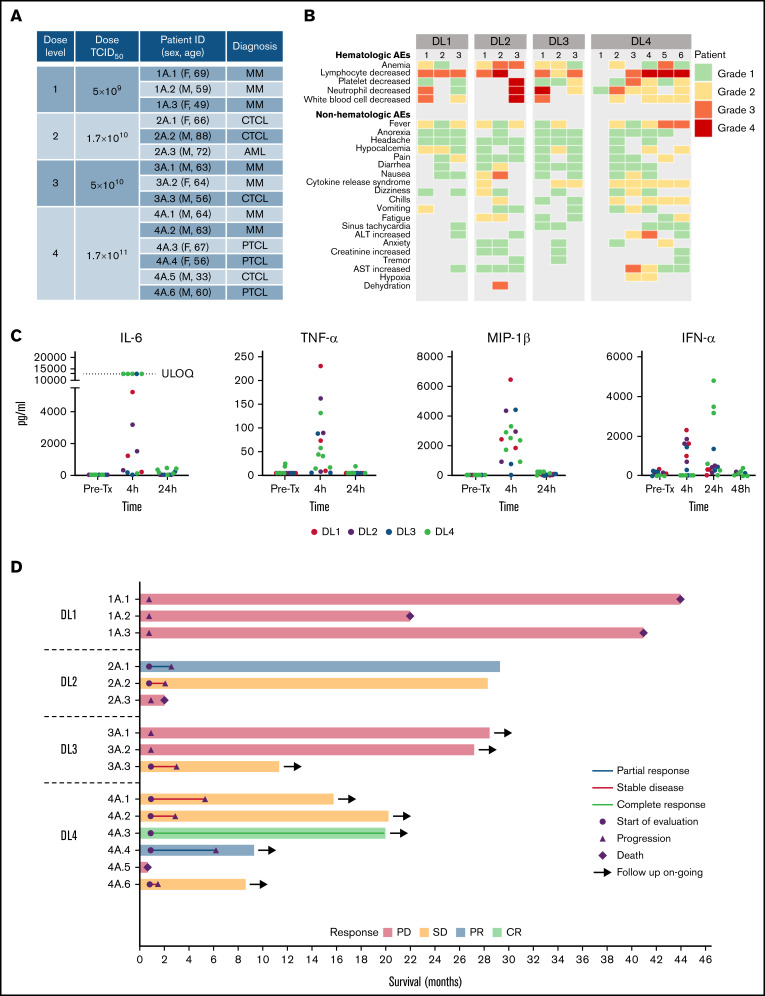
Figure 1.
Clinical outcomes of treatment with 1 IV infusion of VSV-IFNβ-NIS. (A) Summary of patients treated in the study. (B) Maximum grade AEs by DL for each patient. (C) Levels of selected cytokines/chemokines before and after VSV infusion. (D) Swimmer plot (n = 15), in which each bar represents an individual patient as designated. Day 28 responses are indicated. Bars with solid arrows show patients with an ongoing response. ULOQ, upper limit of quantitation.

