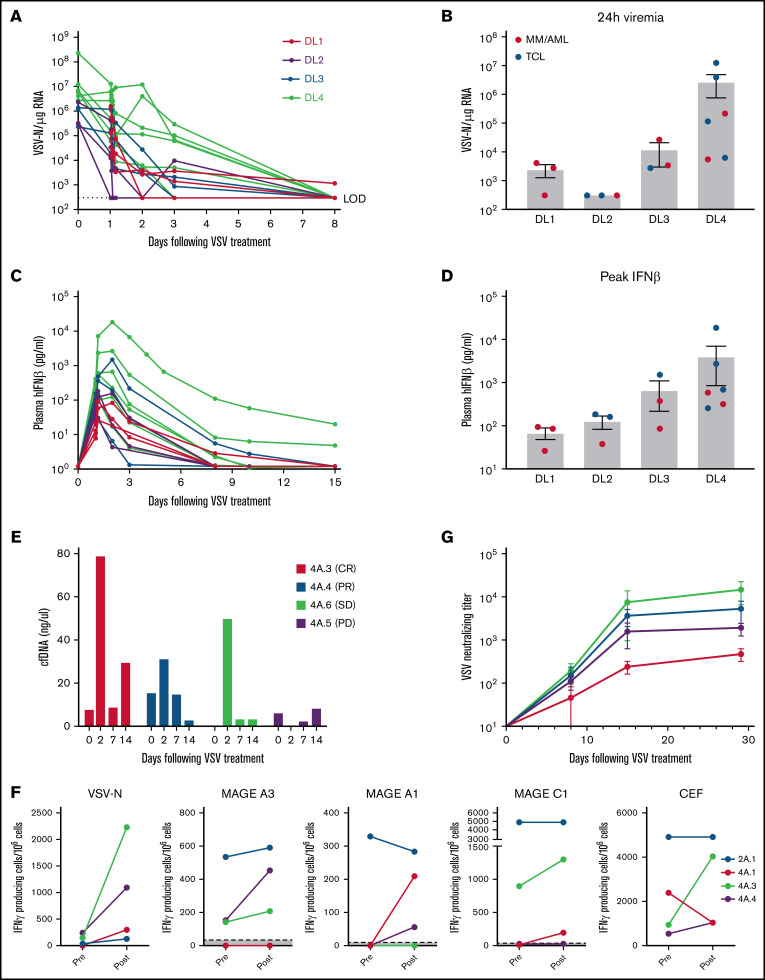
Figure 4.
Pharmacokinetics and pharmacodynamics of VSV-IFNβ-NIS after IV infusion. (A) Profile of viremia (VSV-N RNA in blood) in each patient measured at baseline, end of infusion, 30 minutes, 60 minutes, 4 hours, 24 hours, and 3, 8, 15, and 28 days after VSV. (B) 24-hour viremia levels of each patient at all DLs. Corresponding plasma IFN-β profile (C) and peak IFN-β levels (D) per DL. (E) Cell-free DNA in plasma of patients. (F) IFN-γ ELISPOT assay for T cells reactive against select tumor antigens, VSV-N, or cytomegalovirus, Epstein-Barr virus, and Flu virus positive control. (G) Anti-VSV neutralizing antibody titers (average of patients per DL). Mean ± standard error of the mean shown where applicable.

