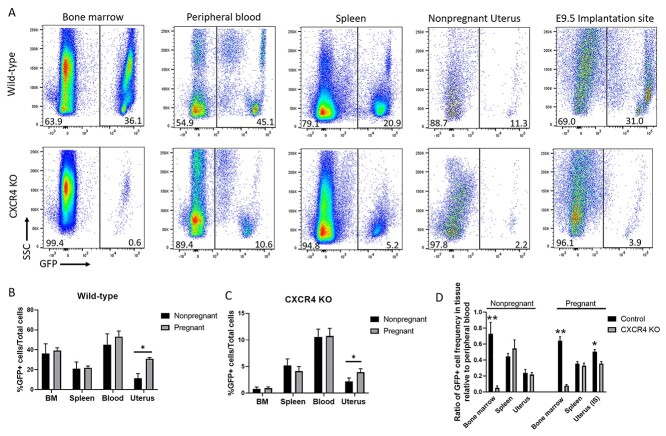
Figure 3.
(A) Flow cytometry analysis showing GFP+ cells in bone marrow, peripheral blood, spleen, nonpregnant uterus, and decidua (E9.5) of CXCR4KO and WT control mice. Live cells were gated on GFP to calculate the percentage of BMDCs (GFP+). Representative flow cytometry plots are shown. (B and C) Quantitative summaries of percentage of GFP+ cells present in bone marrow, spleen, blood, and uterus in (B) WT control and (C) CXCR4KO mice in both pregnant (E9.5) and nonpregnant samples. (D) Quantitative summary of the ratio of GFP+ cell frequency in bone marrow, spleen, and uterus relative to peripheral blood in control and CXCR4KO mice in both pregnant (E9.5) and nonpregnant samples. n = 6 mice/group, *P < 0.05, **P < 0.01. Data in bar graphs are shown as mean ± SEM.

