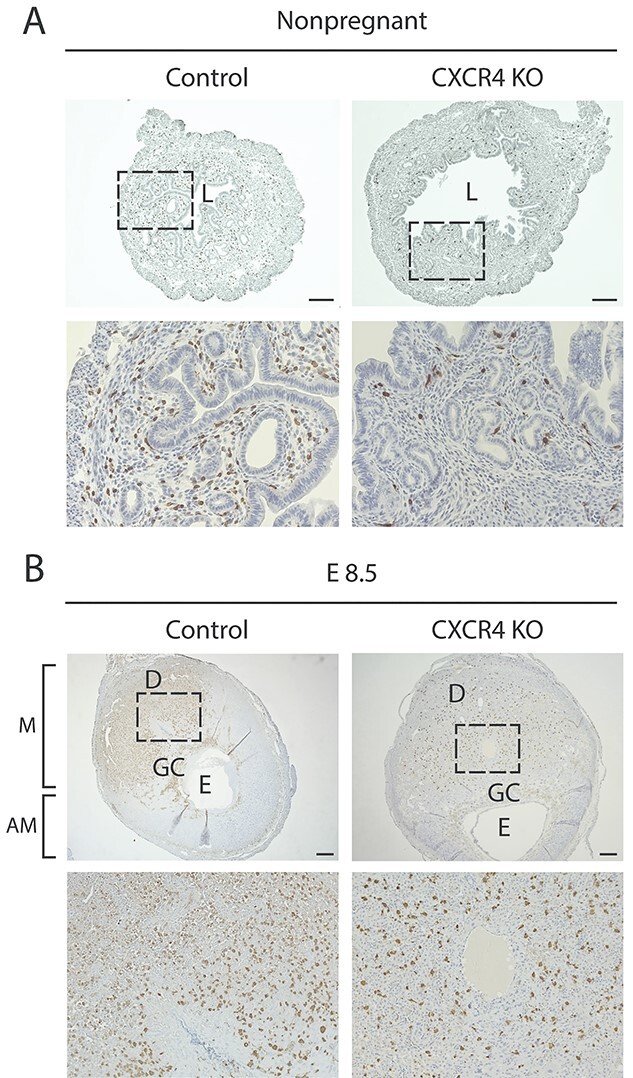
Figure 4.

Immunohistochemistry images of uterine tissue sections from CXCR4KO and control mice. (A) Immunostaining images of nonpregnant uterine tissue sections of control and CXCR4KO stained with GFP antibody (brown). The bottom panel (20×) is a magnification of the dashed area in the upper panel (4×). Scale bar, 200 μm. (B) Immunostaining images of implantation site (E8.5) sections of control and CXCR4KO stained with GFP antibody (brown). The bottom panel (10x) is a magnification of the dashed area in the upper panel (2.5×). Note the concentration of GFP+ BMDCs in the mesometrial (M) area compared to the scant presence in the antimesometrial (AM) area. L, lumen; GC, giant cell layer; E, embryo. Scale bar, 400 μm.
