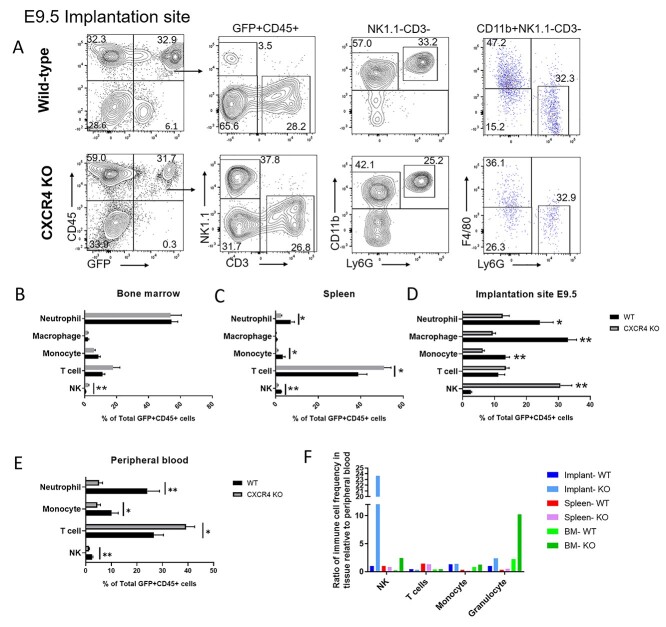
Figure 7.
Multicolor flow cytometry analysis of GFP+ BM-derived hematopoietic cells in nonpregnant and pregnant (E9.5) mice tissues. (A) Gating strategy for flow cytometry analysis of GFP+ cells in implantation site (E9.5) of control and CXCR4KO mice. Live cells were gated on CD45+ and GFP+ to analyze the hematopoietic BMDC population. NK cells were positive for Nk1.1 (NK) but negative for CD3 (T cell) markers, while T cells were CD3+ NK1.1–. Cells were further gated as NK1.1–CD3– to analyze myeloid cells. The markers CD11b, Ly6G, and F4/80 were used to identify granulocytes (Ly6G+ CD11b+ F4/80–), macrophages (F4/80+ CD11b+ Ly6G–), and monocytes (CD11b+ F4/80– Ly6G–). Representative flow cytometry plots of single cells from E9.5 decidual tissue are shown. (B–E) Quantitative summary of the distribution of various immune cell subsets (neutrophils, macrophages, monocytes, T cells, and NK cells) in GFP+ CD45+ hematopoietic BMDCs of control and CXCR4KO mice in (B) bone marrow, (C) spleen, (D) implantation site, and (E) peripheral blood. (F) Quantitative summary of ratio of immune cell frequency (NK cells, T cells, monocytes, and granulocytes) in tissue (decidua, BM, or spleen) relative to peripheral blood in control and CXCR4KO mice. Data shown are the mean of n = 6 mice/group; *P < 0.05, **P < 0.01. Data in bar graphs are shown as mean ± SEM.

