Figure 1.

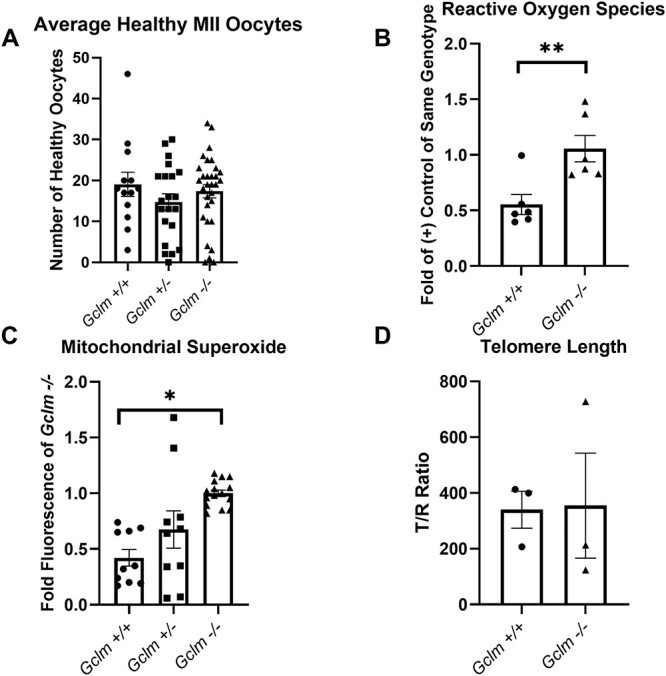
Gclm−/− oocytes have increased levels of ROS compared to Gclm+/+ oocytes. (A) There is no difference in the number of morphologically healthy oocytes ovulated per female of each genotype (N = 13 = 31 females/genotype). (B) Green DCF fluorescence of experimental oocytes relative to mean fluorescence of 0.003% hydrogen peroxide-treated, positive control oocytes of same genotype on the same experimental day is elevated in Gclm−/− oocytes (**P = 0.008, t-test, N = 6 females/genotype; superimposed filled circles, squares and triangles show values for individual oocytes in this and subsequent figures). (C) Gclm−/− oocytes have increased levels of mitochondrial superoxide, as estimated by fold Gclm−/− fluorescence of oocytes analyzed on the same day (*P = 0.045, GEE, N = 5–8 females/genotype). (D) There is no statistically significant difference in telomere length between genotypes (N = 3 pools of 20 oocytes each from 1–3 females/genotype).
