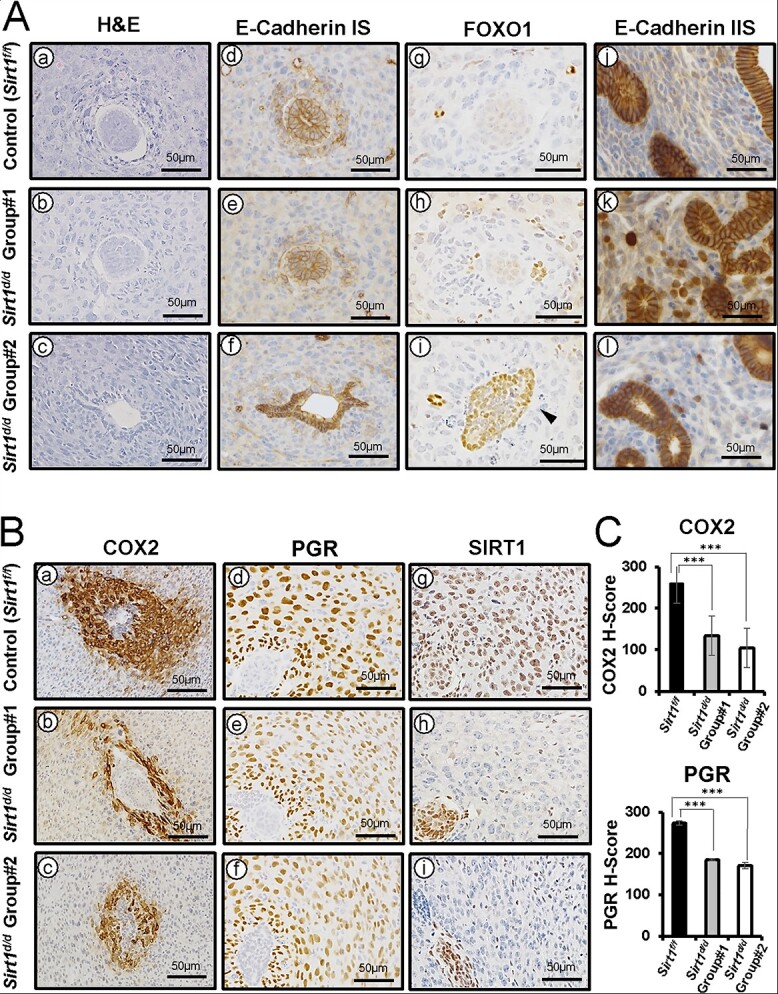
Figure 6.

Altered E-Cadherin, FOXO1, COX2, and PGR expression in GD 5.5 Sirt1d/d uteri (A) Representative images of H&E (a-c), E-cadherin (d-f and j-l), and FOXO1 (g-i) IHC at implantation sites (IS) and inter implantation sites of Sirt1f/f (a, d, g, and j), Sirt1d/d Group #1 (b, e, h, and k), and Sirt1d/d Group #2 (c, f, i, and l). (B) Representative images of COX2 (a-c), PGR (d-f), and SIRT1 (g-i) IHC at GD 5.5 Sirt1f/f (a, d, and g), Sirt1d/d Group #1 (b, e, and h), Sirt1d/d Group #2 (c, f, and i) ISs. (C) Semi-quantitative H-score for COX2 and PGR at Sirt1f/f, Sirt1d/d Group #1, and Sirt1d/d Group #2 ISs. The results represent the mean ± SEM. ***p < 0.001.
