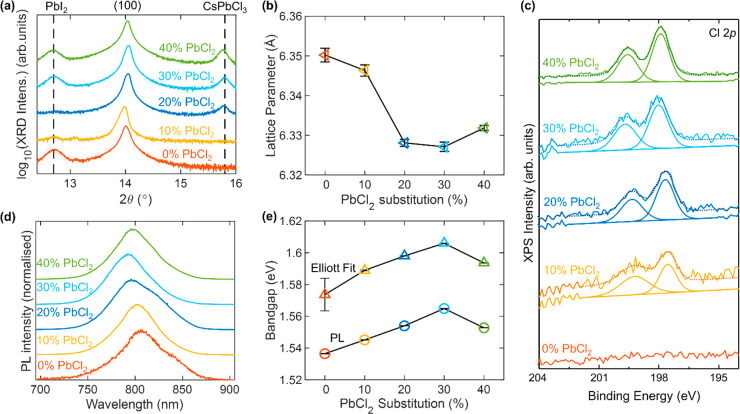
Figure 2.
Evidence for incorporation of Cl into bulk FA1–yCsyPb(I1–xClx)3 perovskite. (a) X-ray diffraction patterns of FA1–yCsyPb(I1–xClx)3 full photovoltaic devices after testing, grown with varying amounts of PbI2 substituted for PbCl2, as depicted in the legend. The y-axis shows the logarithm of the measured intensity to be able to show both the large perovskite peak and the much smaller PbI2 and CsPbCl3 peaks. The XRD patterns were acquired with a Cu–Kα 1.54 Å X-ray source. (b) Lattice parameter obtained from the XRD traces in part a for the bulk perovskite fitted to a cubic unit cell. (c) X-ray photoemission (XPS) high-resolution spectra for thin films of the aforementioned compositions deposited on ITO/PTAA, showing the Cl 2p region. (d) Normalized photoluminescence (PL) of the aforementioned bare films on quartz after photoexcitation at 470 nm. (e) Optical bandgap obtained from fits to the PL and electronic bandgap obtained from Elliot fits to the absorption spectra shown in Figure S10 for the aforementioned bare films on quartz. The error bars in parts b and e represent the 1 standard deviation range (68% confidence interval) for the respective fit parameters.

