
Figure 2.
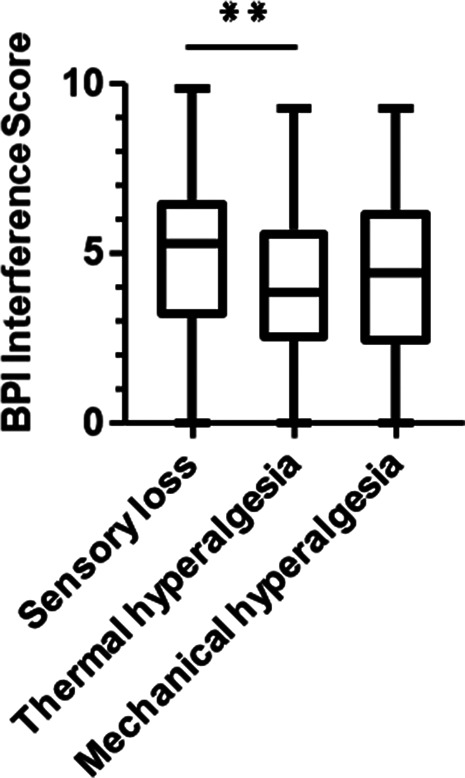
Box plot showing the BPI interference scores of all 3 phenotypes. Differences were significant between “sensory loss” and “thermal hyperalgesia.” **P = 0.002 (logistic regression analysis). BPI was completed by n = 404 participants. BPI, Brief Pain Inventory.