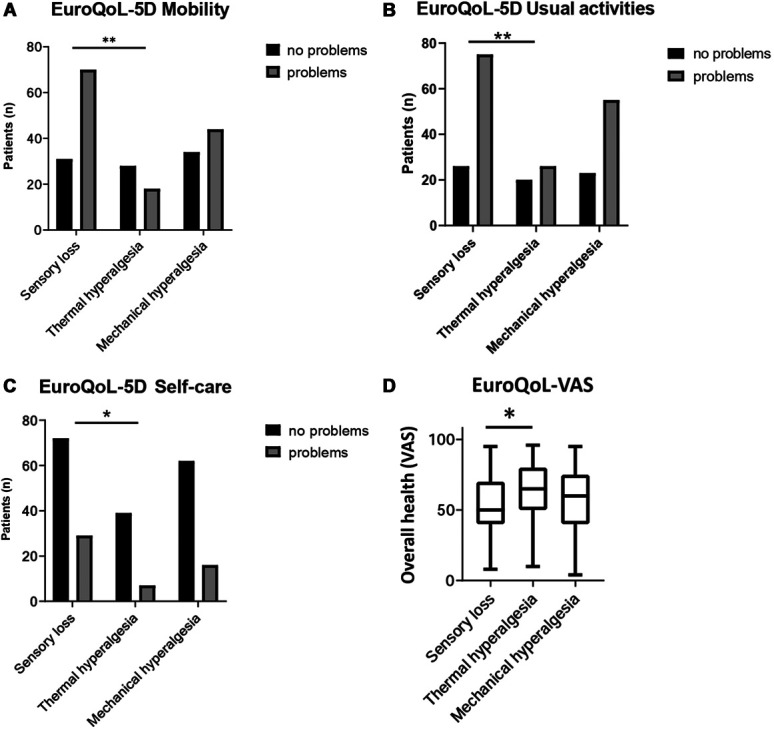
Figure 3.

EQ-5D/-VAS was completed by n = 225 participants. Bar chart showing the distribution of patients with and without problems regarding mobility (A), usual activities (B), and self-care (C) according to EQ-5D. “Some problems” and “extreme problems” were subsumed to solely “problems.” *P < 0.05, **P < 0.01 for logistic regression analysis. (D) Box plot showing the results of the EQ-VAS (visual analogue scale) representing the overall health state. * P < 0.05. EQ-5D, Euro Quality of Life 5D.
