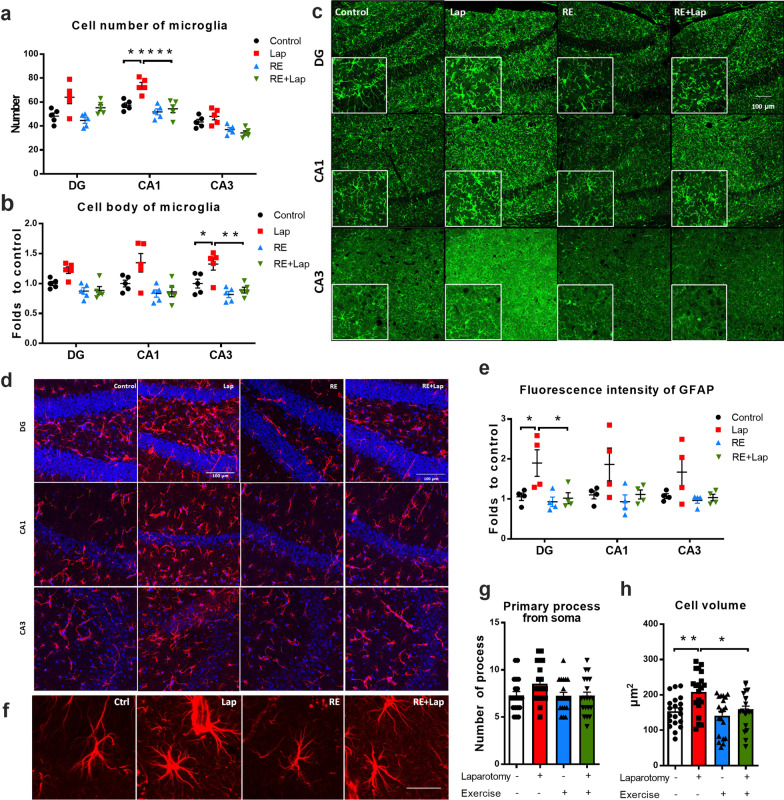
Fig. 5.
Resistance training ameliorated prolonged activation of astroglial in the hippocampus following surgery. a Iba-1+ microglia and b Iba-1+ microglia body size. c Representative z-stacked confocal images showing Iba-1+ microglia (green) in the DG, CA1 and CA3 sub-regions of the hippocampus; Scale bar: 100 μm. Significant reduction in Iba-1 + cells and morphological changes were observed in the RE + Lap compared with Lap group. d Representative z-stacked confocal images showing GFAP+ astrocytes (red) in the DG, CA1 and CA3 sub-regions of the hippocampus. Scale bar = 100 μm. e Quantitative analysis of the fluorescence intensity of GFAP + astrocytes in the different hippocampal regions using Image J. Significant reduction in GFAP+ immunofluorescence was observed in RE + Lap compared with Lapgroup. f Representative enlarged confocal images of GFAP+ astrocytes. Scale bar: 20 μm. g Count of primary processes from cell bodies of GFAP+ astrocyte. h GFAP+ astrocyte cell volume in different experimental groups. Significant reduction in GFAP+ cells volume was observed in the RE + Lap group. Data analyzed by two-way ANOVA, followed by Tukey multiple comparisons test, n = 8 for RT-PCR, n = 5 for IBA1 staining, n = 4 for GFAP staining, n = 20 for morphological analysis of astrocytes. Data presented as mean ± SEM. *p < 0.05, **p < 0.01, ***p < 0.001

