Fig. 8.
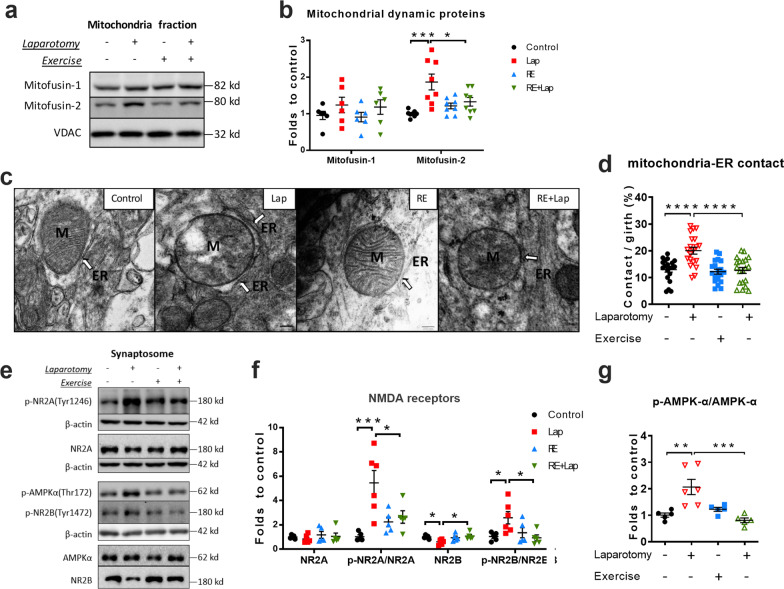
Resistance training modulated mitochondria dynamic following surgery. a and b Representative blots and quantitative analysis of mitofusin-1 and mitofusin-2 in the mitochondria fraction, the intensity of band was normalized to that of VDAC. n = 6 for mitofusin-1, 8 for mitofusin-2. c Representative TEM pictures of ER–mitochondria contacts as indicated by the white arrow. d Quantification of ER–mitochondria contacts, demonstrating by the contact area divided by the mitochondrial girth. n = 20 comprised 5 pictures from 4 mice in each group. e–g Representative blots and quantitative analysis of NMDARs and AMPK-α, with the intensity of band normalized to that of β-actin. Data analyzed by two-way ANOVA, followed by Tukey multiple comparisons test, n = 5 (except for Lap group, n = 6 for the expression of proteins in synaptosome). Data presented as mean ± SEM, *p < 0.05, **p < 0.01, ***p < 0.001. M: mitochondria; ER: endoplasmic reticulum

