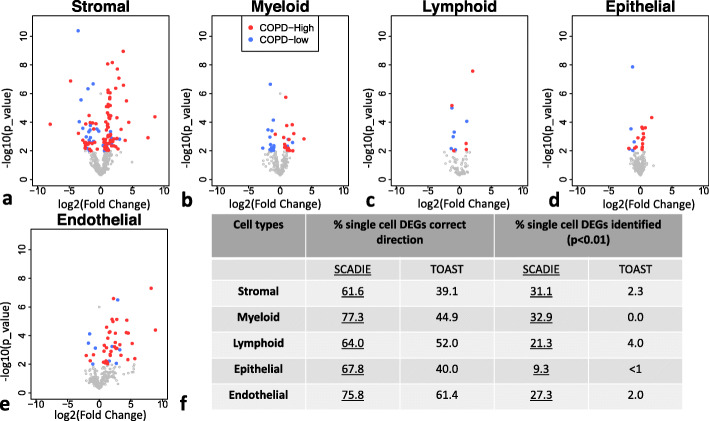
Fig. 5.
Volcano plots for single cell DEGs’ estimated differential expression statuses from SCADIE and their summary: a–e Volcano plots for single cell-identified DEGs in the five component cell types, x-axis represents the log2 fold-change from SCADIE, and y-axis represents each gene’s p-value from SCADIE. f A summary table for benchmarking SCADIE against TOAST using the same COPD datasets, the first two columns summarize the percentages of single cell DEGs that were of concordant directional changes from bulk data, and the last two columns summarize the percentages of single cell DEGs that were correctly identified as DEGs from bulk data

