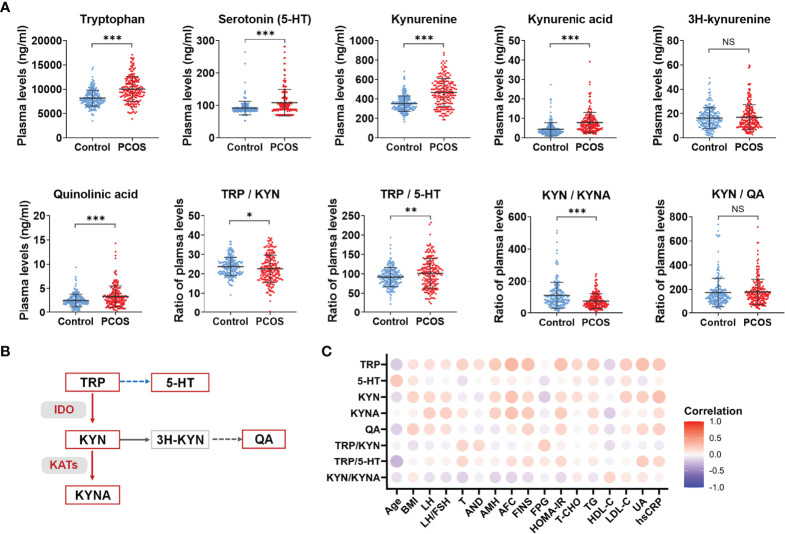
Figure 1.
Abnormal activation of tryptophan-kynurenine pathway in PCOS. (A) The plasma level changes of metabolites in tryptophan-kynurenine pathway in PCOS patients compared with control groups, ***p < 0.001; **p < 0.01; *p < 0.05; NS, not significant. (B) The sketch Map of changes of metabolites and key enzymes in tryptophan-kynurenine pathway in PCOS patients. The red color indicates increased metabolism and activated enzymes, the blue color indicates decreased metabolism, and the grey color indicates that the change trend of this pathway was not yet clear. (C) Correlation analysis of differential metabolites levels with the endocrine and metabolic parameters in all subjects. TRP, tryptophan; 5-HT, serotonin; KYN, kynurenine; KYNA, kynurenic acid; QA, quinolinic acid.

