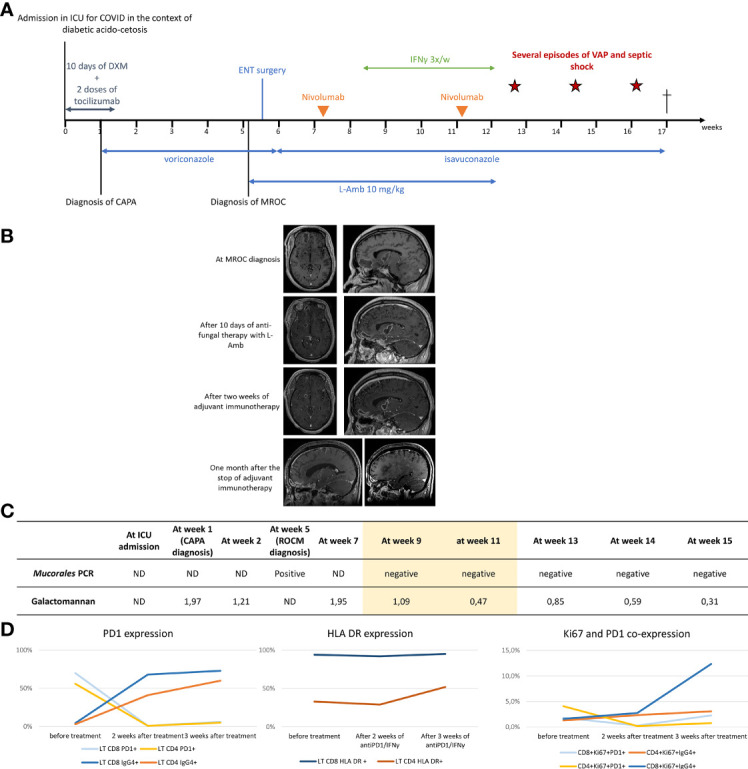
Figure 1.

Clinical, radiological and microbiological evolution under treatment. (A) Timeline. The cross indicates the death of the patient. (B) Evolution of cerebral MRI under treatment. Frontal abscess: 35x15 mm at diagnosis, 32,9 mm immediately after surgical drainage (not shown) 30 x 13 mm after 10 days of antifungal therapy with L-Amb, 24 x 42 mm after two weeks of adjuvant immunotherapy, 14 x 9 mm one week after the stop of adjuvant immunotherapy (not shown) and 9 x 7.2 one month after the stop of adjuvant immunotherapy. lenticulo-capsular abscess: 28 x 14 mm at diagnosis 28 x 17 mm after 10 days of antifungal therapy with L-Amb 24 x 14 mm after two weeks of adjuvant immunotherapy, 17 x 11.5 mm one week after the stop of adjuvant immunotherapy (not shown) and 9.5x7 mm one month after the stop of adjuvant immunotherapy. One morth after the stop of adjuvant immunotherapy, the two initial abscesses had reduced in size. However, shown in the bottom right MRI image, several new cerebral abscesses had appeared. (C) Evolution of seric GM and Mucorales PCR under treatment. The yellow color underlines the time under immunotherapy. (D) Evolution of PD-1, HLA-DR and Ki67 expression on circulating LT CD4+ and LT CD8+ under treatment. Expression of PD-1,HLA-DR and Ki67 were measured before treatment with nivolumab and 2 and 3 weeks after immunotherapy initiation. After nivolumab injection, PD-1 expression is less, detected as T cells are covered by the anti-PD1 antibody. Cells covered with nivolumab were identified using an anti-IgG4 detection approach. Ki67 has been identified a maker of cellular proliferation and T-cell reinvigoration upon checkpoint blockade (1) As shown in the right graft, the increase in Ki67 expression was most prominent in the IgG4+ versus PD-1+ CD8 and CD4 T celle, i.e., in T cell covered with nivolumab.
