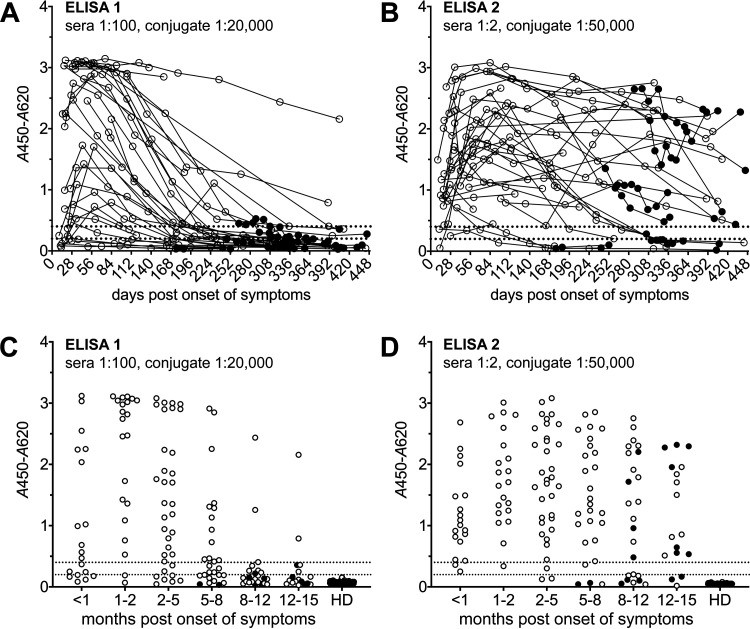
FIG 3.
Diagnostic sensitivity. Longitudinal serum samples from 35 COVID-19 patients were analyzed using ELISA 1 (A and C) and ELISA 2 (B and D). (A and B) Trajectories (individual patients; 1 to 13 samples/patient; n = 213). (C and D) Stratification according to months after the onset of symptoms (≤1 sample/patient/category; n = 146). Dotted lines indicate A450-A620 values of 0.2 and 0.4. HD, healthy donors (Germany) (n = 139). Filled dots indicate postvaccination samples (spike-based vaccine).

