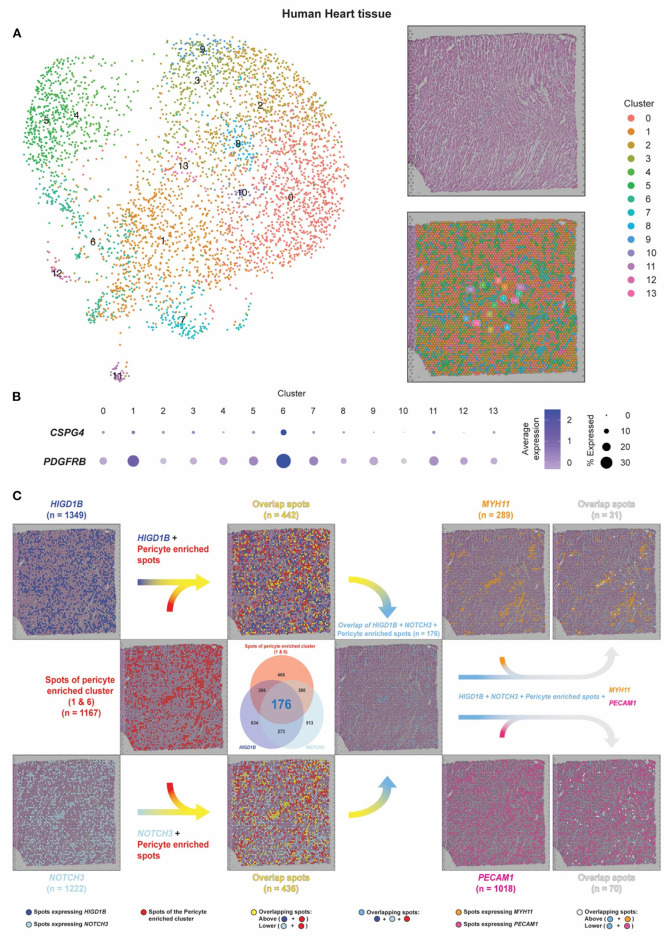
Figure 5.
Pericyte transcripts locate on capillaries in human heart tissue by spatial transcriptomic analysis. (A) The spatial transcriptomic data of the human heart tissue from the Spatial Gene Expression Dataset by 10 × Genomics Space Ranger (10 × Genomics Space Ranger 1.1.0) was used to investigate the pericyte spatial localization within the heart tissue and compare it with regions of the capillaries and the arteries. (B,C) Based on the expression of CSPG4 and PDGFRB, spots of clusters 1/6 were designated as pericyte spots (shown as red dots). Dark blue dots indicate spots that express HIGD1B. Cyan dots indicate spots that express NOTCH3. Sky blue dots indicate spots that co-express HIGD1B and NOTCH3 among the pericyte spots. Spots that expressed MYH11 were identified as smooth muscle coverage of arteries (shown as orange dots). Spots that expressed PECAM1 were identified as endothelial cells and capillary lumens (shown as dark pink dots).

