Fig. 8.
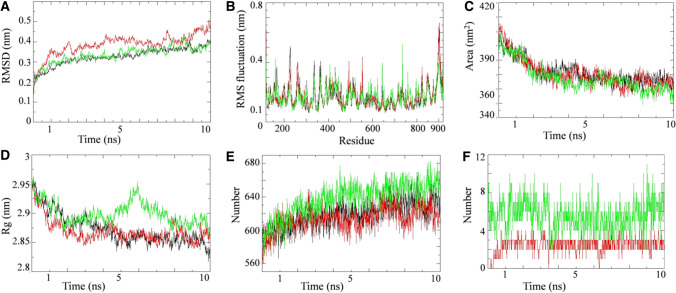
Simulation results of W. somnifera lead phytochemical targeting RdRP protein. Plot of molecular dynamic simulation trajectories of COVID-19 RdRP protein and protein-ligand complexes during 10 ns simulation. A The root mean square deviation (RMSD) of solvated SARS-CoV2 RdRP protein and RdRP -favipiravir and RdRP-Quercetin-3-rutinoside-7-glucoside complex during 10 ns molecular dynamics simulation. B The root mean square fluctuation (RMSF) values of solvated SARS-CoV2 RdRP protein and RdRP-favipiravir and RdRP-Quercetin-3-rutinoside-7-glucoside complex plotted against residue numbers. C Plot of solvent accessible surface area (SASA) during 10 ns molecular dynamics simulation of SARS-CoV2 RdRP protein and RdRP-favipiravir and RdRP-Quercetin-3-rutinoside-7-glucoside complex. D Plot of radius of gyration (Rg) during 10 ns molecular dynamics simulation of SARS-CoV2 RdRP protein and RdRP-favipiravir and RdRP-Quercetin-3-rutinoside-7-glucoside complex. E Plot of number of hydrogen bond in the SARS-CoV2 RdRP protein in unbound state and bound with favipiravir and Quercetin-3-rutinoside-7-glucoside. F Plot of number of hydrogen bonds formed between RdRP and favipiravir along with RdRP and Quercetin-3-rutinoside-7-glucoside. Unbound protein parameters are depicted in black color. Parameters for RdRP-favipirvavir complex and RdRP-Quercetin-3-rutinoside-7-glucoside complex are represented in red and green color respectively

