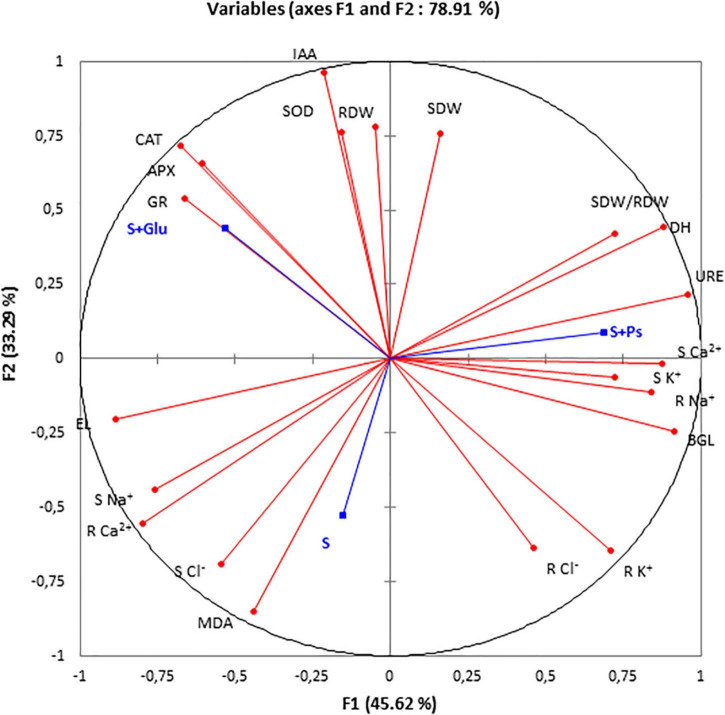
FIGURE 6.
Principal component analysis (PCA). Circles (∙) represent different analysis parameters. Squares (■) represent different treatments (S, S + Ps, and S + Glu). All studied parameters and the different treatments are projected onto the F1–F2 principal factorial plane that explains 78.91% of the variation. SDW, shoot dry weight; RDW, root dry weight; SDW/RDW, shoot dry weight/root dry weight ratio; MDA, malondialdehyde; CAT, catalase activity; APX, ascorbate peroxidase activity; SOD, superoxide dismutase activity; GR, glutathione reductase activity; DH, dehydrogenase; URE, urease; BGL, β-glucosidase; IAA, indole-3-acetic acid; S Na+, shoot sodium content; S K+, shoot potassium content; S Ca2+, shoot calcium content; S Cl–, shoot chloride content; R findings Na+, root sodium content; R K+, root potassium content; R Ca2+, Root calcium content; and R Cl–, root chloride content.

