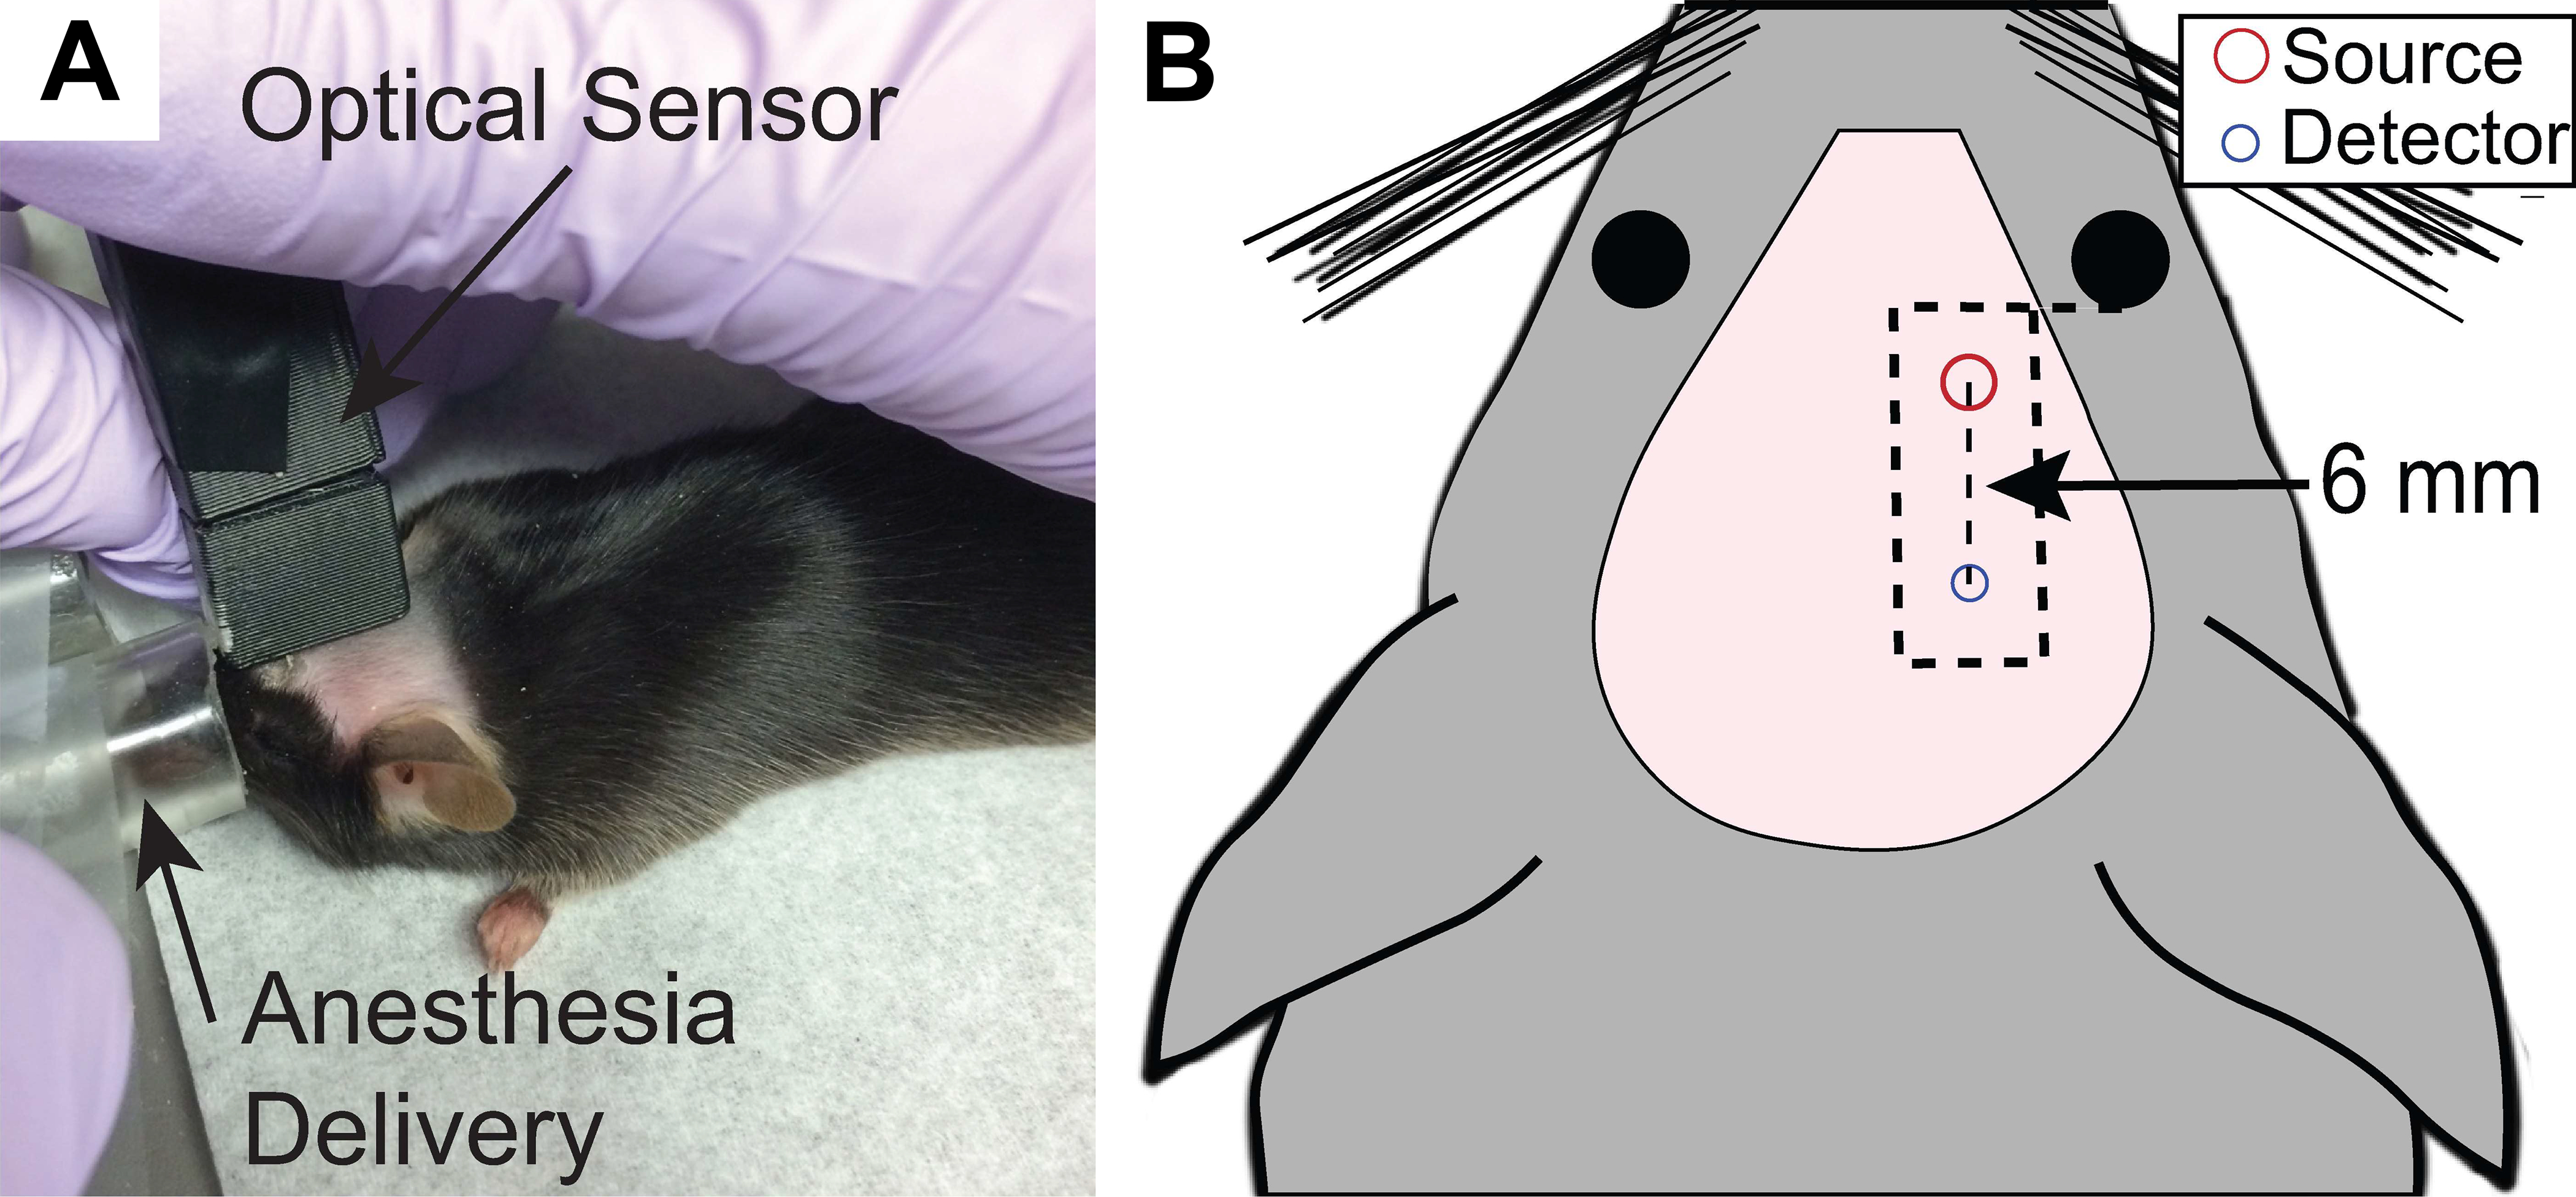
Figure 3: Measurement of cerebral blood flow by Diffuse Correlation Spectroscopy.

(A) An optical sensor is gently manually held over the right hemisphere to measure blood flow in an anesthetized mouse. (B) Representative sensor placement on the right hemisphere. The outline of the sensor is represented as a dashed black rectangle, and the location of the source and detector fibers are in red and blue circles, respectively. The sensor is placed such that the short edge of the sensor lines up with the back of the eye and the long edge of the sensor aligns with the midline.
