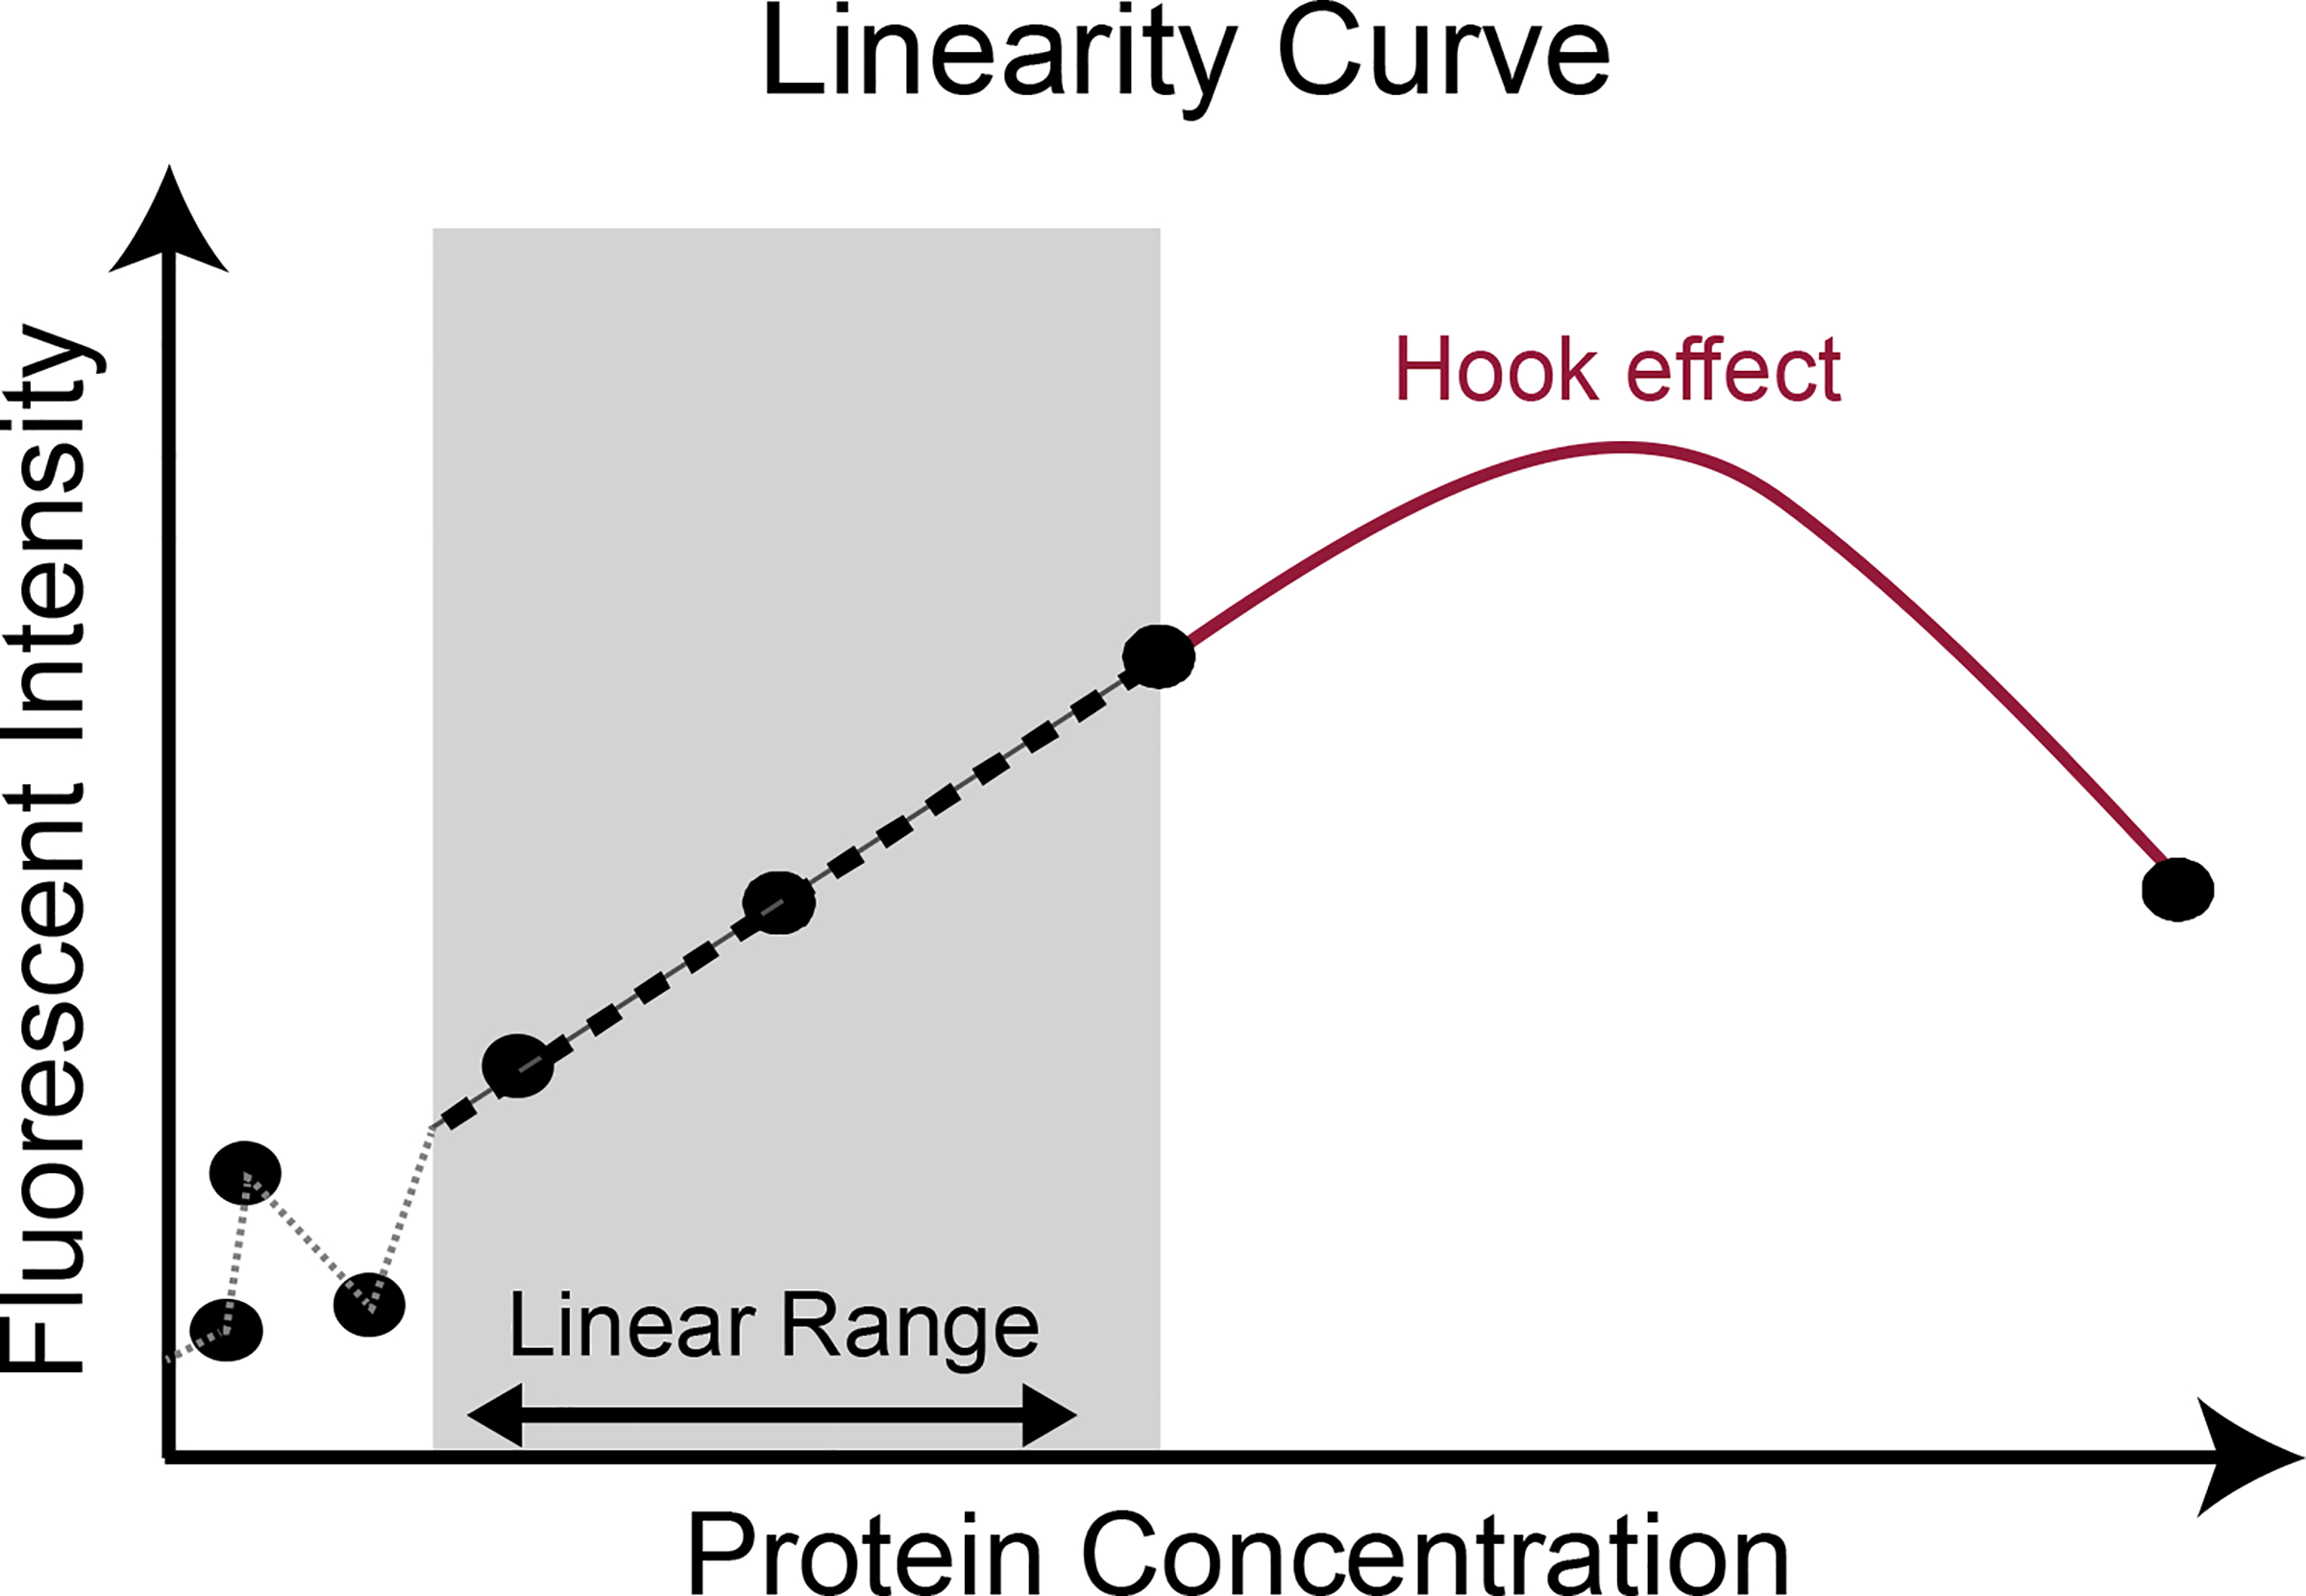
Figure 7: Illustration of sample dilution curve to identify the linear range.

Protein concentration of serially diluted samples versus fluorescent intensity measured from the Luminex assay. The linear range is defined as the protein concentration range for which the relationship between the protein concentration and fluorescent intensity is linear (arrow). In some analytes, increasing the protein concentration beyond a certain limit can decrease antibody binding such that the dilution curve becomes non-linear or inverted (Hook effect).
