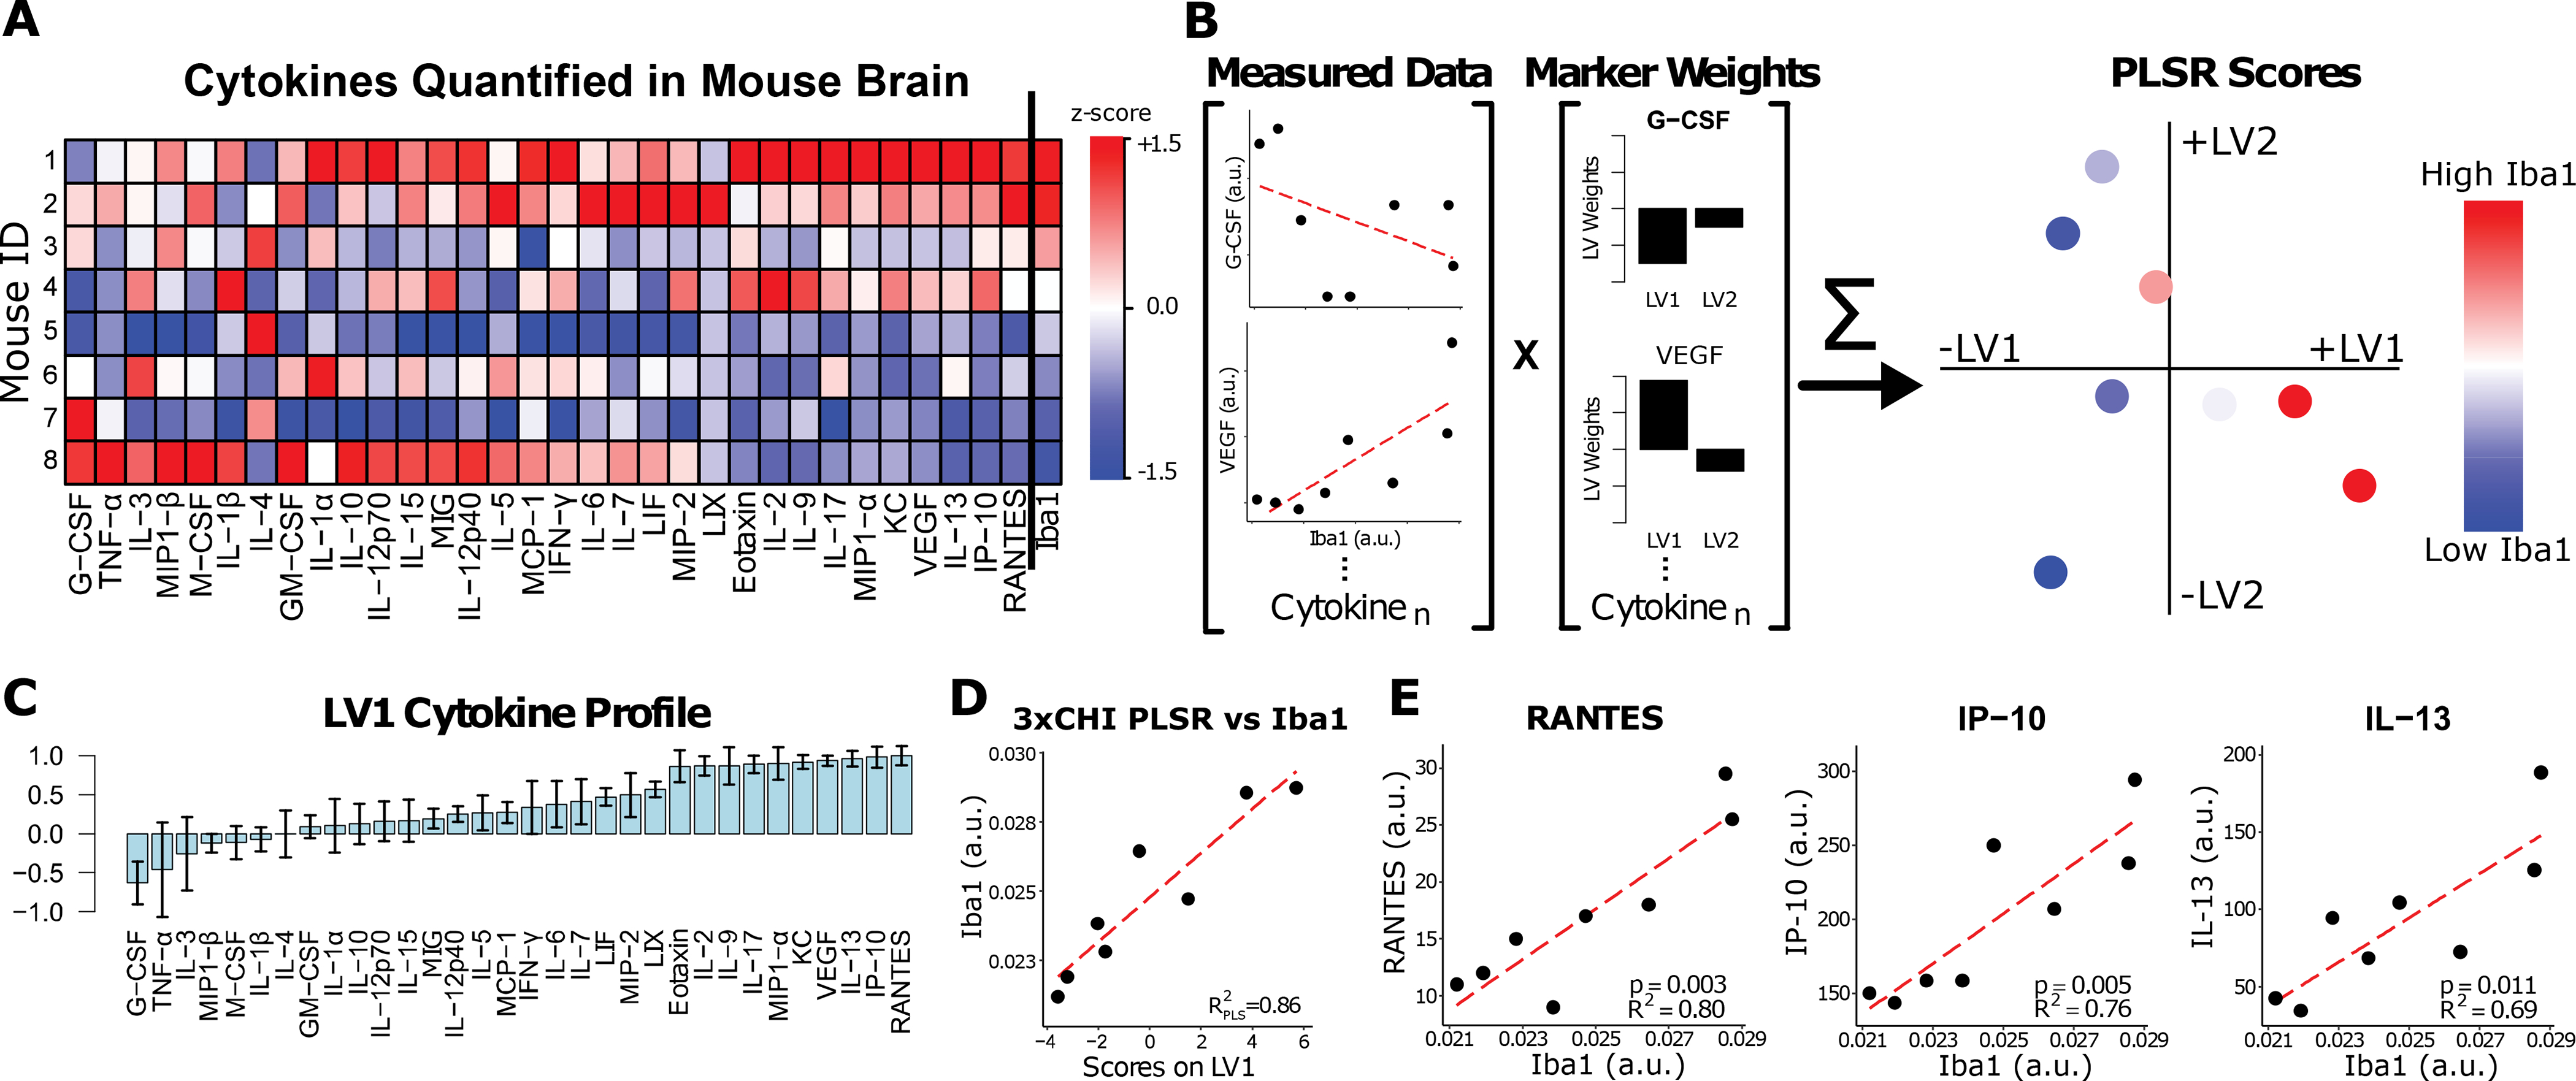
Figure 8: Representative Partial Least Squares Regression (PLSR) Analysis.

(A) Panel cytokine protein expression (left columns) together with Iba1 expression (righthand column) in 3xCHI mice (n=8, z-scored). (B) PLSR assigns weights (loadings) to measured cytokines for each latent variable. Weights are applied to measured data to compute scores for each sample on each latent variable. (C) PLSR of 3xCHI samples against Iba1 identified a weighted profile of cytokines, LV1, which distinguished samples by Iba1. Cytokines with negative weights were upregulated in samples with low Iba1 while cytokines with positive weights were upregulated in samples with high Iba1 (mean ± SD using a LOOCV). (D) Linear regression of LV1 scores for each sample against Iba1. R2PLS measures the goodness of fit between Iba1 and LV1. (E) Individual regressions of Iba1 against each of the cytokines with the greatest weights in LV1 in C.
