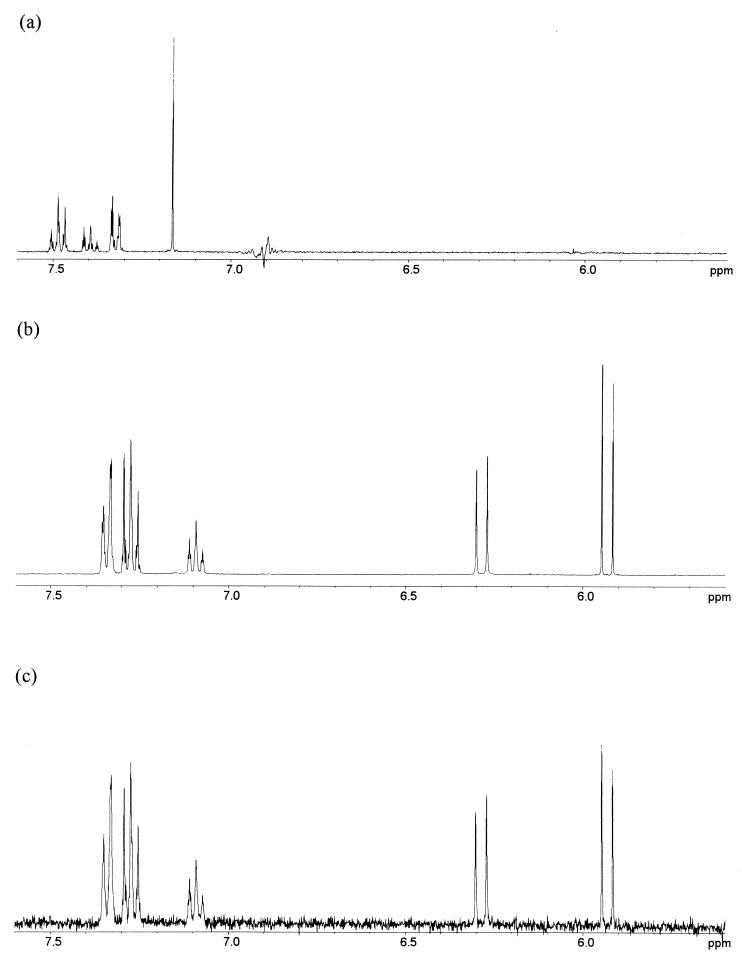
FIG. 3.
NMR spectra for NPM and NPMA. (a) The 1H NMR spectrum of NPM in d6-dimethyl sulfoxide (DMSO) at 400 MHz (DMSO reference at 2.50 ppm). (b) The 1H NMR spectrum of synthetic NPMA in K10 medium-D2O at 400 MHz. (c) 1H NMR of the product of detoxification of NPM by E. coli cells in D2O at 400 MHz.

