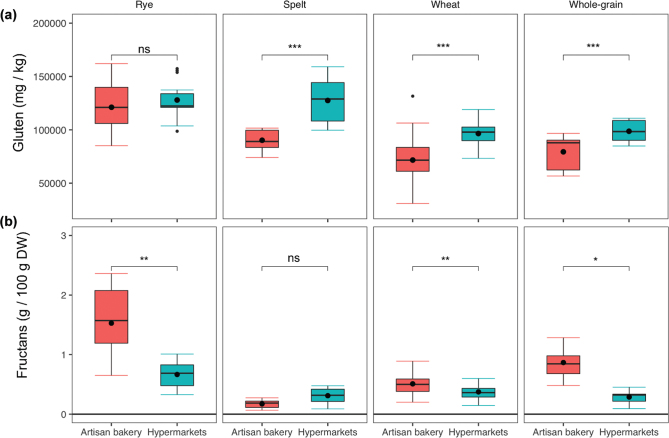
Fig. 2.
Comparison of breads from artisan bakeries and hypermarkets in terms of gluten (a) and fructan contents (b). Statistically significant differences: ‘***’, ‘**’, and ‘*’, at 0.001, 0.01, and 0.05 levels, respectively; ns, no significant; DW, dry weight. The black dot indicates the mean. Statistical significances were calculated by t-test and Mann–Whitney test for parametric and non-parametric data, respectively.

