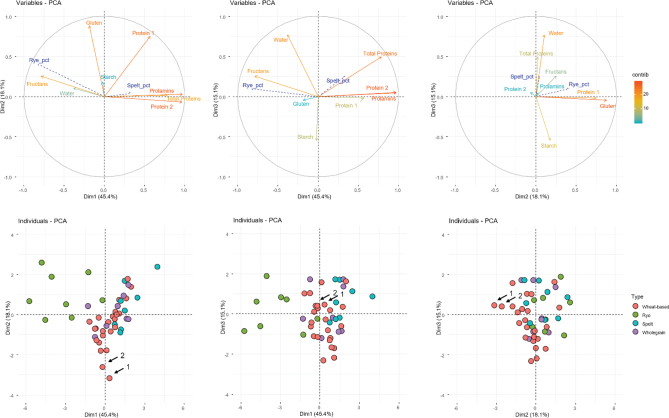
Fig. 4.
Principal components analysis (PCA). 1) First and second dimensions, 2) first and third dimensions, and 3) second and third dimensions plots of the (up) variables in a color gradient according to the contribution to the variability and supplementary variables in blue and (down) individual breads colored according the generic type they are sold. Variables Protein 1 and ppm contribute almost only to second dimension. Breads pointed with arrows, the lowest immunotoxic ones, are made of (1) 100% durum wheat and of (2) 40% tritordeum. Pct, percentage; Dim, dimension; contrib, contribution.

