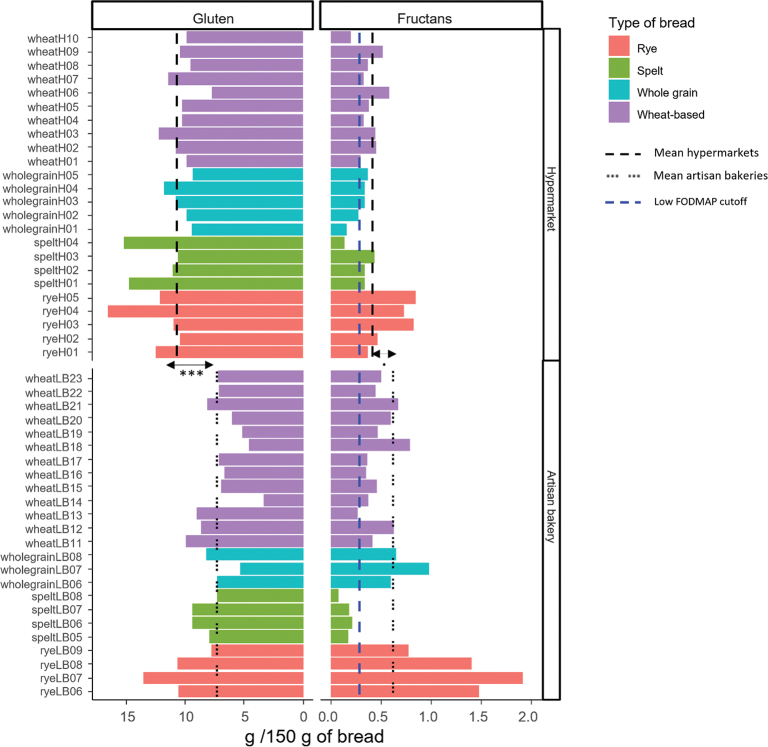
Fig. 5.
Total gluten and fructan intakes (g/150 g bread) for each bread. Mean value for each section is represented with black-dashed lines. Low-FODMAP cut-off value for bread wheat is denoted by the blue-dashed line (0.3) (27). Gluten intake was calculated as follows: gluten (ppm) × 150 bread (g) × 10E-6 × (1-water content [%]). Fructans intake was calculated as follows: fructan content (g/100 g FW bread) × 150 bread (g)/100 g. FW: fresh weight·, P ~ 0.05; ***, P < 0.001. Statistical significances were calculated by t-test and Mann–Whitney test for parametric and non-parametric data, respectively.

