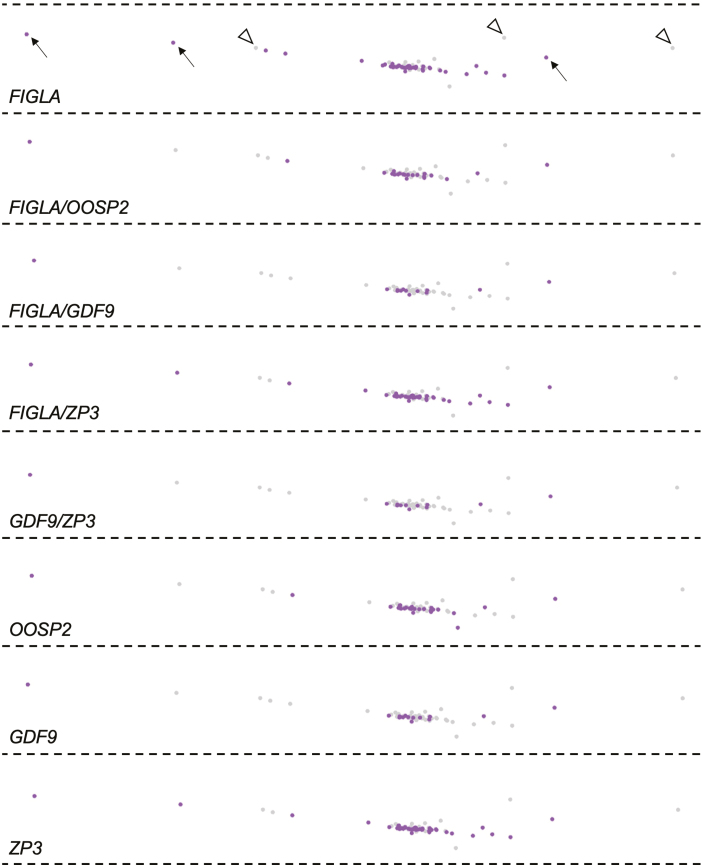
Figure 2.
Cell-by-cell analysis of oocyte-associated markers in the germ cell/oocyte cluster using Cell Ranger v6 followed by Loupe Browser. Cells identified as positive for expression of the indicated gene(s) are dark shaded in purple (examples are highlighted by black arrows in the uppermost panel) whereas cells negative for expression of the indicated gene(s) are light shaded in gray (examples are highlighted by white arrowheads in the uppermost panel).

