FIGURE 1.

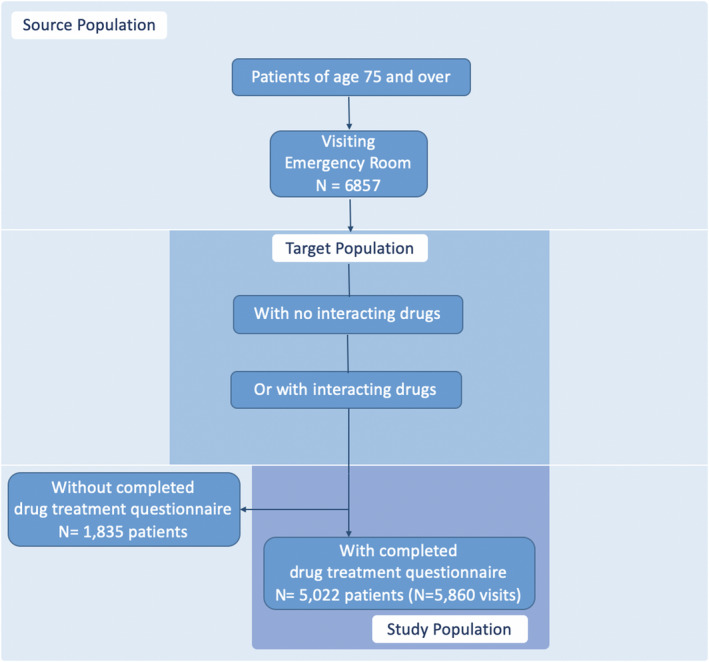
Flow chart of study population selection. If a patient presented several admissions, each admission drug questionnaire was included. “Created by the authors”

Flow chart of study population selection. If a patient presented several admissions, each admission drug questionnaire was included. “Created by the authors”