
Figure 5.
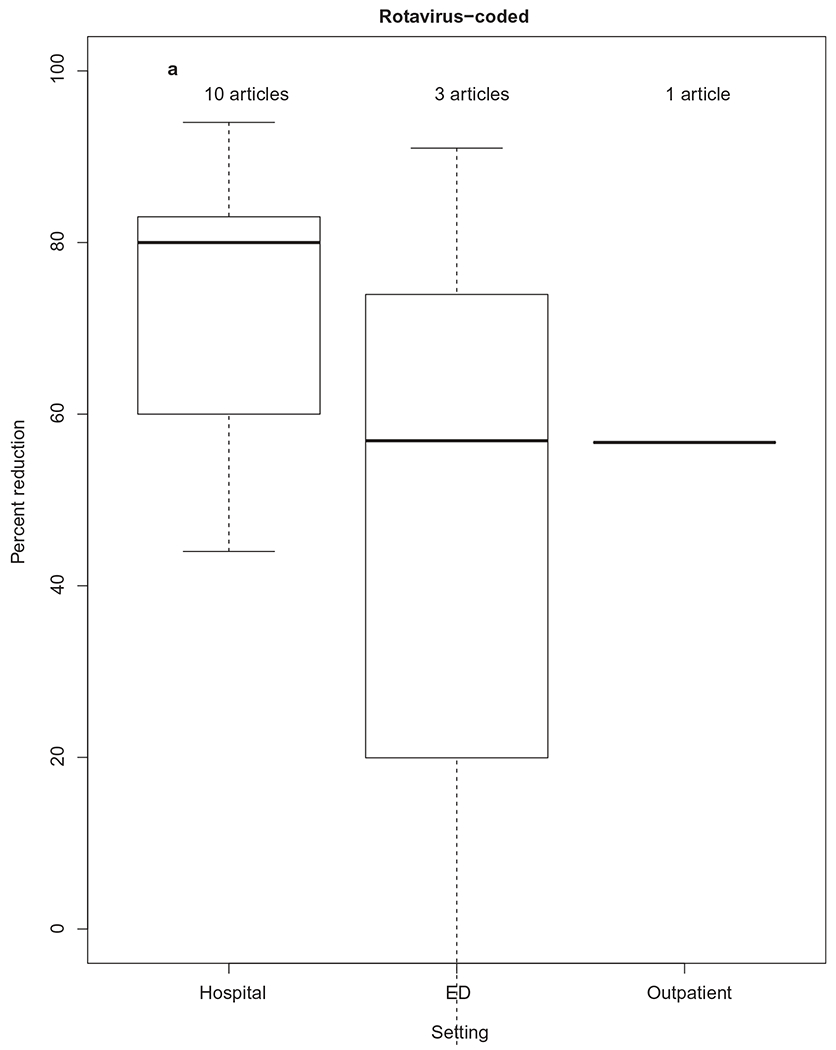
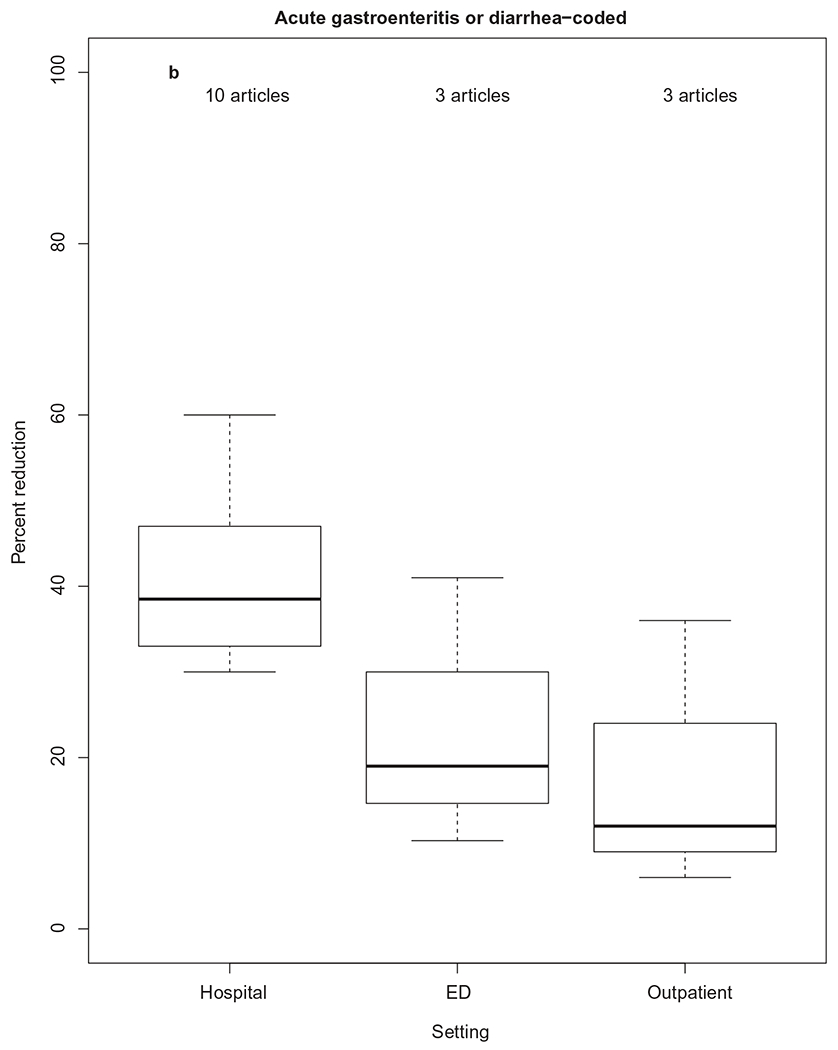
Percent reduction in rotavirus-coded or acute gastroenteritis-coded health-care utilization, by health-care setting. The thick horizontal lines represent the median percent reduction, by health-care setting. The upper and lower limits of each box represent 75th and 25th interquartile ranges of the data by health-care setting.