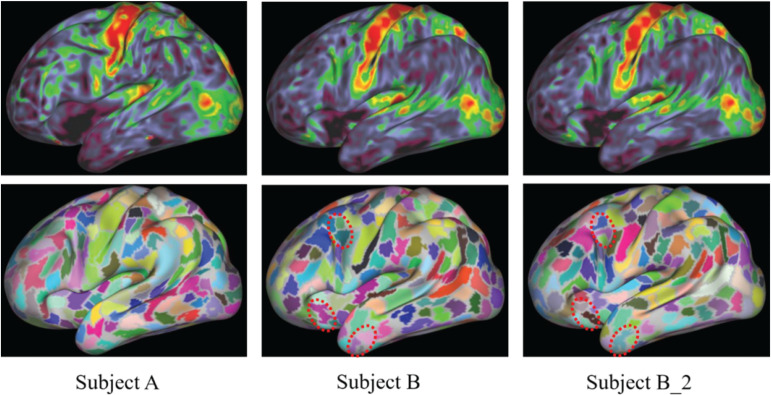
Fig. 4.
Sample images of the myelin map (upper) and parcels (lower) displayed on an inflated cortical surface in the left hemisphere. Individual differences between subject A and subject B were visually found in both the myelin map and parcels. B_2 shows the results of the reanalysis of subject B. Slight differences between the results in B and B_2 were visually found in the parcels inside the circle with the dotted line but were not found in the myelin maps.

