Fig. 5.
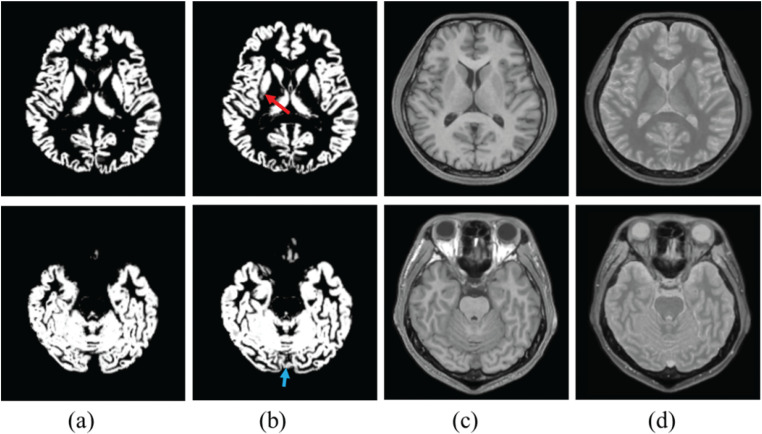
Representative image of segmented gray matter image in (a) synthetic (T1- and proton density-weighted) segmentation and (b) single contrast (T1-weighted) segmentation. (c) is a T1-weighted image and (d) is a proton density-weighted image. Red and blue arrows show mis-segmentation in single-contrast segmentation.

