An official website of the United States government
Here's how you know
Official websites use .gov
A
.gov website belongs to an official
government organization in the United States.
Secure .gov websites use HTTPS
A lock (
) or https:// means you've safely
connected to the .gov website. Share sensitive
information only on official, secure websites.
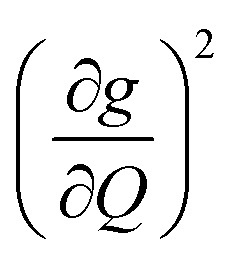
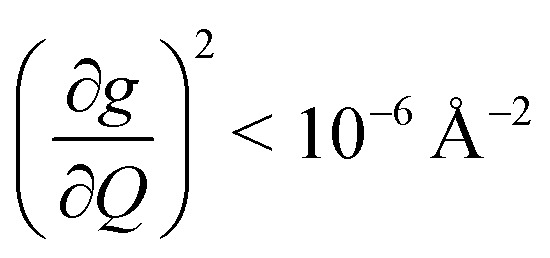
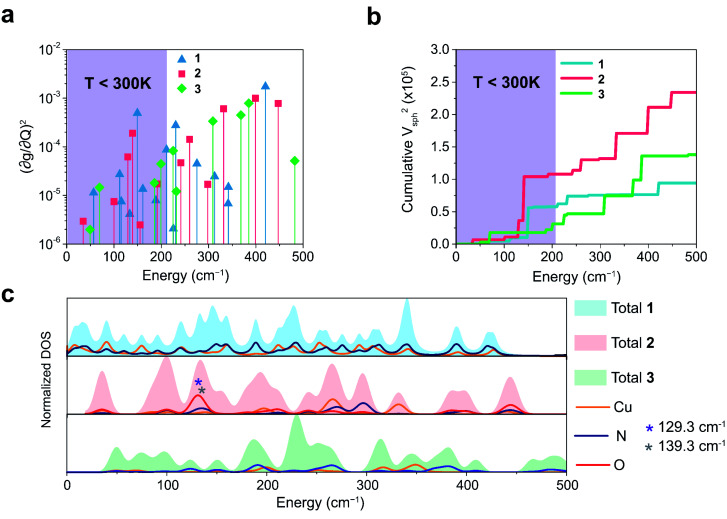
 between 0 and 500 cm−1 (modes with
  are omitted for clarity). Values are expressed in units of Å−2 (b) total SPC (cumulative) of all modes with increasing energy. Large increases in SPC generally occur stepwise, with single highly coupled modes contributing heavily to SPC. Values are expressed in units of Å−2. In both (a) and (b), the energy range below 300 K (208.5 cm−1) corresponding to modes thermally occupied at room temperature, is highlighted in purple (c) atom-resolved vibrational density-of-states (DOS) for 1–3.