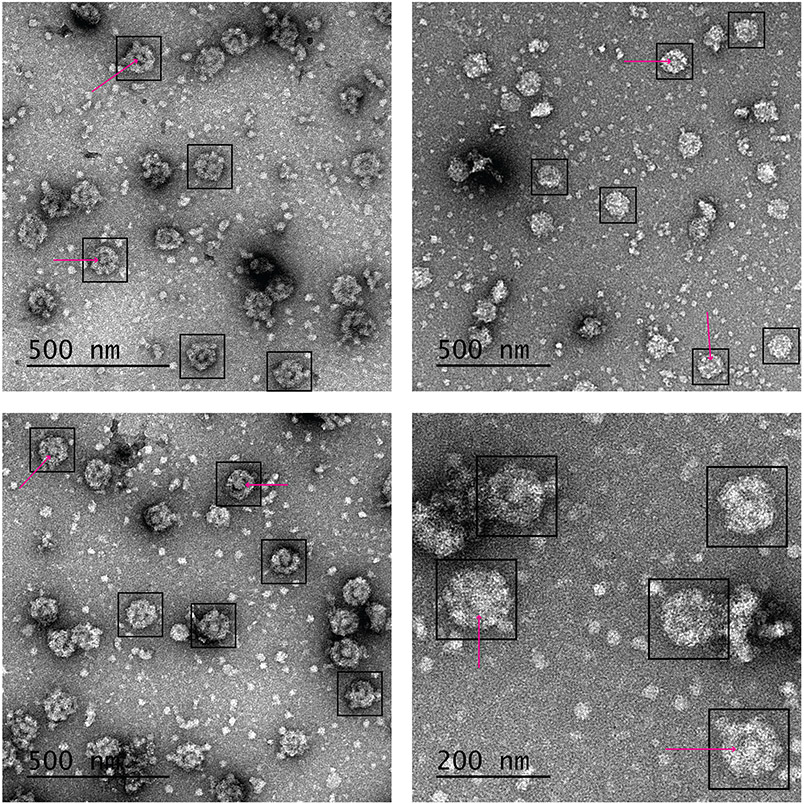
Fig. 3. Negative stain EM images.
Four representative images at different magnifications taken using grids prepared and imaged as described in section 3.6. Black boxes indicate a selection of individual NPCs. Magenta arrows point to central transporters within selected NPCs. Scale bar indicated in black in the bottom left side of every image.

