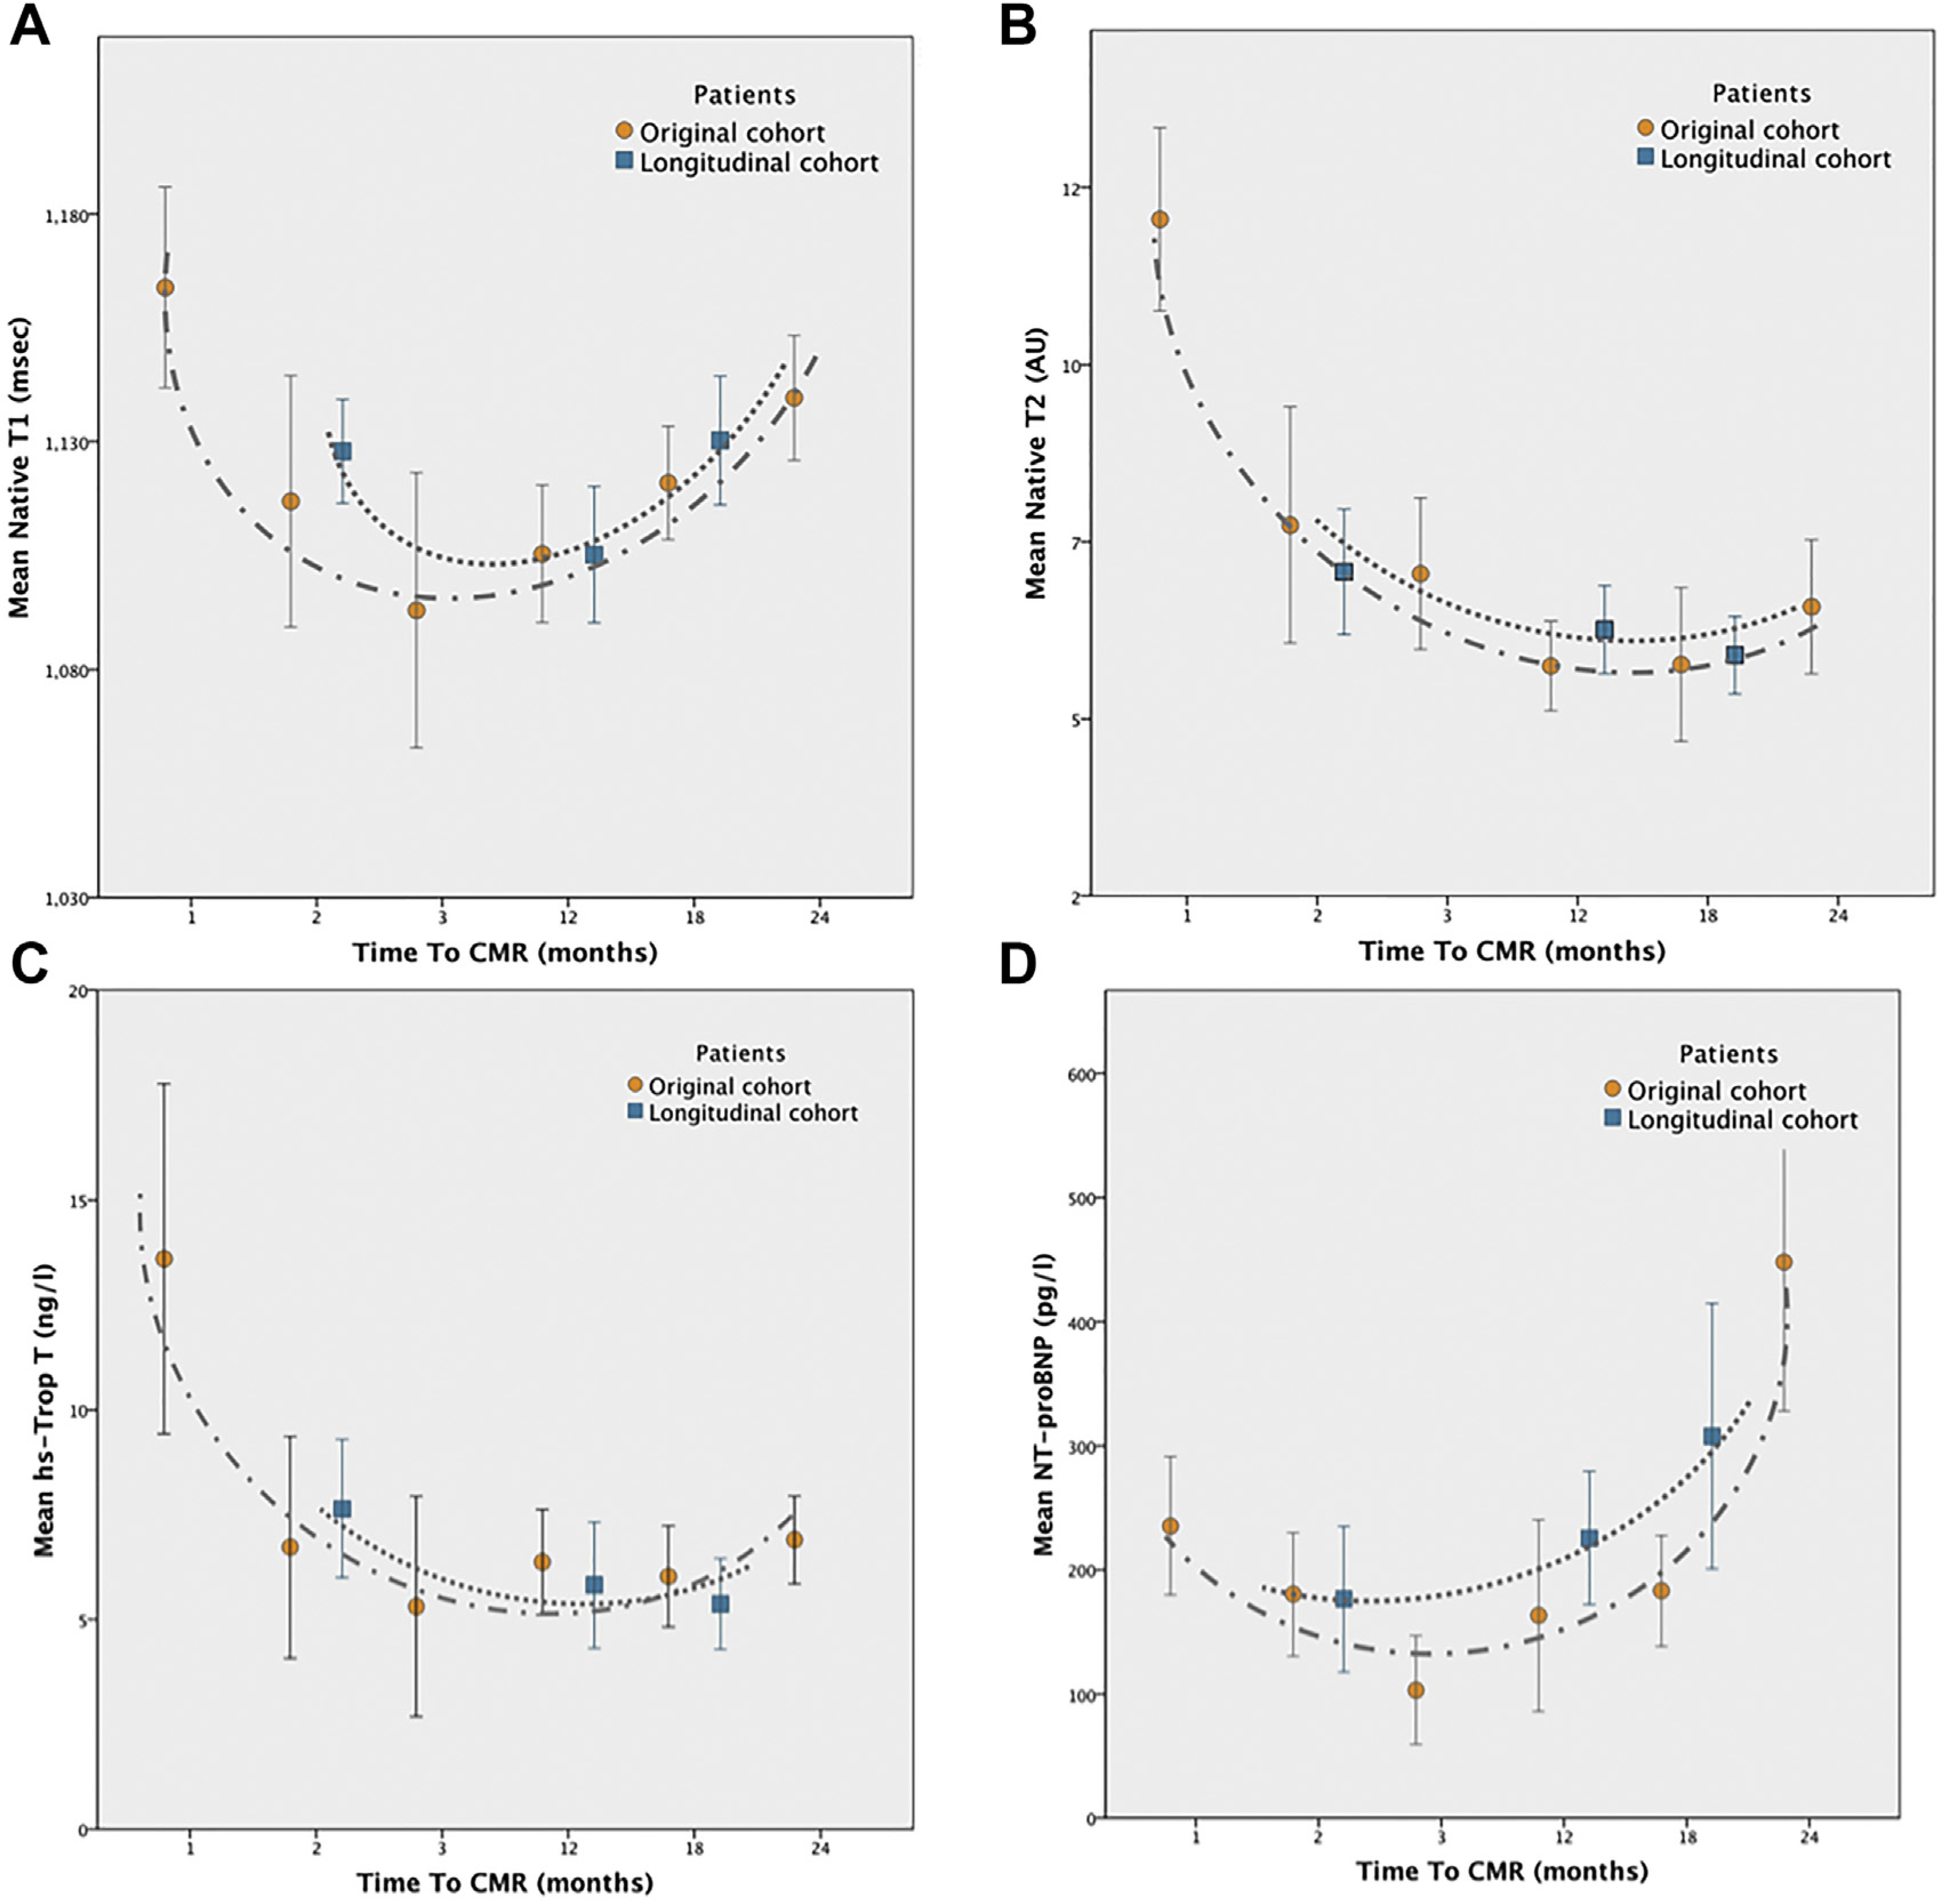
Fig. 5.

(A) Temporal changes in noncontrast tissue characteristics demonstrate acute processes with elevated native T1 (B) and T2 are then followed by a resolution in T2 values, when late increased native T1 is associated with myocardial fibrosis. Biomarker data (shown in C and D) follow the CMR imaging findings. (From Haslbauer JD, Lindner S, Valbuena-Lopez S, et al. CMR imaging biosignature of cardiac involvement due to cancer-related treatment by T1 and T2 mapping. Int J Cardiol. 2019;275:179–186; with permission.)
