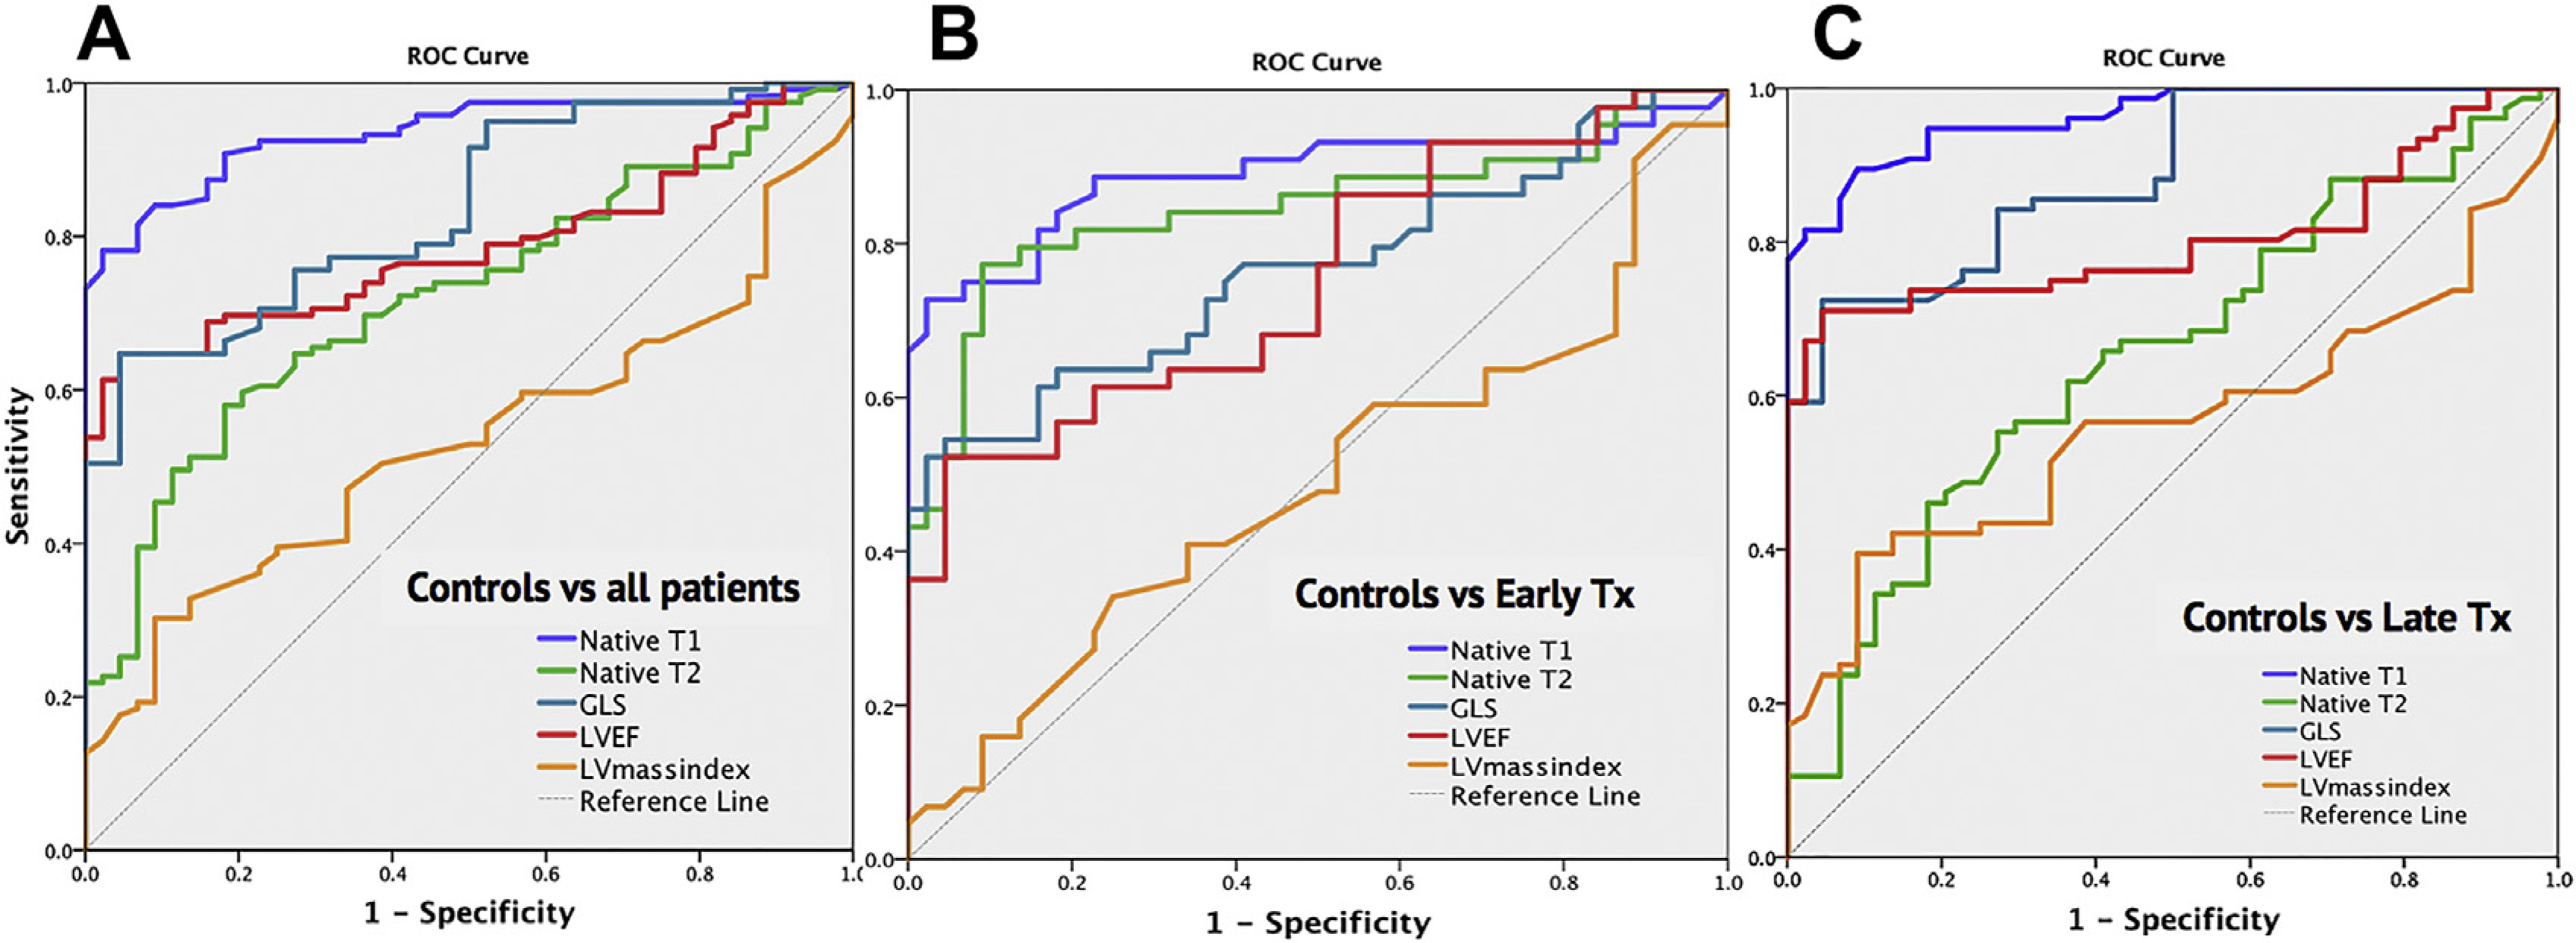
Fig. 6.

ROC curve from all patients (A) demonstrating noncontrasted CMR tissue characterization (native T1 and T2) outperform functional measures such as left ventricular ejection fraction (LVEF) and global longitudinal strain (GLS) in identifying cardiotoxicity following cancer-related therapy. Native T1 outperformed other CMR measures whether early after treatment (B) or late after treatment (C). (From Haslbauer JD, Lindner S, Valbuena-Lopez S, et al. CMR imaging biosignature of cardiac involvement due to cancer-related treatment by T1 and T2 mapping. Int J Cardiol. 2019;275:179–186; with permission.)
